
Statistics facts for kids

Statistics is a special kind of science that deals with data. It helps us gather, look at, understand, and share information. Statistics is used in many areas, like medicine, economics (how money works), psychology (how people think), and marketing (selling things). A person who works with statistics is called a statistician.
Statistics gives us ways to collect data without wasting time or resources. This can be done through surveys or controlled experiments. Once data is collected, we can use two main methods to understand it:
- Statistics helps us describe the data. This is called descriptive statistics. It's about finding simple ways to summarize large amounts of data. This makes it easier to understand the main points. Summarizing data also helps us find common patterns. In statistics, these patterns are called probability distributions. We look at the results of an experiment and see how they are grouped.
- After data is described, it can be used for prediction. This is called inferential statistics. For example, a biologist might study how big animals grow. They could create a model that predicts a baby animal will be small if its parents were small. This model helps predict size better than just guessing. Another example is testing if a drug can cure a disease. Scientists compare results from people who took the drug with those who took a placebo (a fake drug).
Contents
History of Statistics
People have used statistics for a very long time. The first known uses were for census data. A census counts people and collects information about them. The ancient Babylonians did a census around 3500 BC. The Egyptians did one around 2500 BC, and the Ancient Chinese around 1000 BC.
How We Collect Data
Before we can describe the world using statistics, we need to gather data. The information we collect is called measurements. After collecting data, we use numbers to describe each observation.
For example, imagine we want to know how popular a TV show is. We can choose a group of people, called a sample, from all the viewers (the population). Then, we could ask them how often they watch the show. Or, we could attach a device to their TVs to measure it.
Another example: if we want to know if a drug lowers blood pressure, we could give the drug to people. Then, we measure their blood pressure before and after they take it.
Methods for Data Collection
Most of the time, we collect statistical data using surveys or experiments. In a survey, we pick a small group of people and ask them questions. Their answers become our data.
Choosing the right individuals for a survey or data collection is very important. It directly affects the statistics we get. Once the statistics are done, we cannot tell which specific individuals were chosen. For instance, if we measure the water quality of a large lake, samples taken near a waste drain will be different from samples taken far away.
There are two common problems when taking samples:
- If we take many samples, the results will likely be very close to what they are in the real population. But if we take only a few samples, they might be very different. This type of mistake is called a chance error.
- The individuals for samples need to be chosen carefully, usually randomly. If not, the samples might be very different from the total population. This can happen even with many samples. This kind of mistake is called bias.
Dealing with Errors
We can reduce chance errors by taking a larger sample. We can avoid some bias by choosing people randomly. However, sometimes it's hard to get large random samples. Bias can also happen if some people are not asked, or refuse to answer. It can also happen if people know they are getting a fake treatment. These problems can be difficult to fix.
Descriptive Statistics
Descriptive statistics helps us summarize and understand our data.
Finding the Middle of the Data
The "middle" of the data is called an average. The average tells us about a typical individual in the group. There are three common types of average: the mean, the median, and the mode.
Let's use this example data: Name | A B C D E F G H I J --------------------------------------------- score| 23 26 49 49 57 64 66 78 82 92
Mean (The Usual Average)
The mean is found by adding up all the values and then dividing by the number of values.
For our example scores: (23 + 26 + 49 + 49 + 57 + 64 + 66 + 78 + 82 + 92) / 10 = 58.6
A problem with the mean is that very large or very small values can change it a lot. For example, if 10 people earn $10 a day, and one person earns $1,000,000 a day. The mean income is about $90,918 a day. This average doesn't really describe what most people in the room earn.
Median (The Middle Value)
The median is the middle number when the data is sorted from smallest to largest. If there's an even number of data points, there won't be one exact middle number. In that case, we take the two middle numbers and find their mean.
In our example, there are 10 scores. When sorted, the two middle scores are 57 and 64. So, the median is (57 + 64) / 2 = 60.5.
The median is good because extreme values (like the $1,000,000 income) don't affect it as much as they affect the mean.
Mode (The Most Common Value)
The mode is the value that appears most often in the data. For example, if we look at letters in English, the letter "e" is the mode because it's the most common.
In our score example, the score 49 appears twice, and all other scores appear once. So, the mode is 49.
Sometimes, there can be more than one mode. If two or more values appear with the same highest frequency, they are all modes. For example, if scores 20 and 90 both appeared three times, and no other score appeared more than twice, then 20 and 90 would both be modes. This is called "bi-modal" (two modes). Bi-modal data often means there are two different groups within the data. For instance, the average height of adults in the U.S. has two peaks: one for men and one for women.
The mode is the only type of average that can be used for data that cannot be put in order (like favorite colors).
Finding the Spread of the Data
Another important thing about data is how "spread out" it is. A common way to describe this spread is the standard deviation.
If the standard deviation is small, it means most of the data points are very close to the average. If it's large, it means many data points are very different from the average.
If data follows a common pattern called the normal distribution, knowing the standard deviation is very helpful. For normally distributed data:
- About 68 out of every 100 data points will be within one standard deviation of the average.
- About 95 out of every 100 data points will be within two standard deviations of the average.
- About 997 out of every 1000 data points will be within three standard deviations of the average.
Other Descriptive Statistics
We can also use statistics to find out what percent, number, or fraction of people or things in a group fit a certain category.
For example, social scientists used statistics to find out that about 49% of people in the world are males.
Images for kids
-
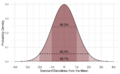
The normal distribution, a very common probability density shape.
-

Gerolamo Cardano, an early thinker in the math of probability.
-

Karl Pearson, who helped create modern statistics.
-
gretl, a free computer program for statistics.


See Also
 In Spanish: Estadística para niños
