
Standard deviation facts for kids


Standard deviation is a number that tells you how spread out a group of measurements or data points are from their average (also called the mean). If the standard deviation is small, it means most numbers are very close to the average. If it's large, the numbers are more spread out.
Imagine you're measuring the heights of your friends. If everyone is about the same height, the standard deviation will be small. But if some friends are very tall and others are very short, the standard deviation will be large.
Scientists often use standard deviation in their experiments. It helps them understand how much their results might vary from the average. They usually think differences are important only if they are much bigger than the standard deviation. Standard deviation is also useful in money to understand how much an investment's value might change.
Sometimes, we can only measure a small part of a group, called a sample. In this case, we can find a number that is close to the standard deviation for the whole group. This is called the sample standard deviation. The standard deviation for a whole group is shown by the Greek letter  (sigma), and for a sample, it's shown by
  .
.
Contents
What is Standard Deviation?
Standard deviation helps us understand how much individual data points in a set differ from the average value of that set. It gives us a clear picture of the data's spread.
How to Calculate Standard Deviation
Let's look at an example to see how standard deviation is calculated.
Consider a group of eight numbers:

First, find the average (mean) of these numbers. Add them up and divide by how many there are:
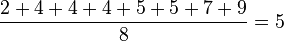
The average is 5.
Next, find out how far each number is from the average. Then, square that difference (multiply it by itself):
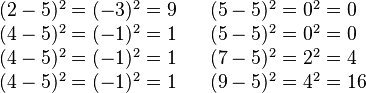
Now, add up all these squared differences:

Then, find the average of these squared differences. Divide the sum by the total number of items (which is 8):

Finally, take the square root of this average:

So, the population standard deviation for this group of numbers is 2. This formula works if these eight numbers are the entire group you are studying.
If these numbers are just a sample from a larger group, you would divide by 7 (which is 8 minus 1) instead of 8 in the second-to-last step. This small change is called Bessel's correction.
Real-Life Examples of Standard Deviation
Standard deviation helps us understand how much variety there is in real-world data.
Heights of People
Let's say the average height for grown men in the United States is 70 inches. If the standard deviation is 3 inches, it means:
- About 68% of men are between 67 inches (70-3) and 73 inches (70+3) tall. This is within one standard deviation.
- About 95% of men are between 64 inches (70-6) and 76 inches (70+6) tall. This is within two standard deviations.
- Almost all men (about 99.7%) are within three standard deviations of the average.
This is true if the heights follow a normal distribution, which looks like a bell shape on a graph. If the standard deviation were 0, all men would be exactly 70 inches tall. If it were 20 inches, heights would vary a lot more, from about 50 to 90 inches!
Sports Performance
In sports, standard deviation can show how consistent a team or player is.
- A team with a low standard deviation in their performance categories (like scoring, defense) is usually more balanced and predictable. They perform well consistently.
- A team with a high standard deviation might be very good at one thing (like offense) but very weak at another (like defense). This makes them less predictable.
For example, in racing, a driver's lap times are measured. A driver with a low standard deviation in lap times is more consistent. This information can help them improve their performance.
Understanding Financial Risk
In money, standard deviation can show the risk of an investment. It tells you how much a price (like for stocks or bonds) might go up or down.
- A higher standard deviation means higher risk. Your investment could earn much more than expected, but it could also lose much more.
- A lower standard deviation means lower risk. The returns are more predictable, and there's less chance of big losses or big gains.
For instance, if you're choosing between two stocks:
- Stock A: Average return of 10% with a standard deviation of 20 percentage points.
- Stock B: Average return of 12% with a standard deviation of 30 percentage points.
Stock A is safer because its value is less likely to swing wildly. Even though Stock B has a slightly higher average return, its much higher standard deviation means it's riskier. You might choose Stock A if you want a more stable investment.
Normal Distribution and Standard Deviation
Many math formulas for standard deviation work best when numbers are normally distributed. This means the numbers are spread out evenly around the average value. This type of spread is also called a Gaussian distribution or the bell curve because its graph looks like a bell.
If numbers are mostly grouped on one side of the average, they are not normally distributed. The standard deviation still tells you how spread out the numbers are, but the rules about percentages (like 68% within one standard deviation) might not apply perfectly.
Average and Standard Deviation Together
The average (mean) and the standard deviation are often given together. This helps people quickly understand both the central value of a group of numbers and how much those numbers vary.
Another way to show how spread out numbers are is the coefficient of variation (CV). This is the standard deviation divided by the average. It's a number without units and is often shown as a percentage.
History of Standard Deviation
The term standard deviation was first used by Karl Pearson in 1894. Before that, other names were used for the same idea, like mean error by Carl Friedrich Gauss.
Related topics
Images for kids
-
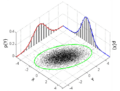
The standard deviation ellipse (green) of a two-dimensional normal distribution.

See also
 In Spanish: Desviación típica para niños
