Standard error facts for kids
The standard error is a way to measure how much an estimate from a small group (called a sample) might be different from the true value for the whole big group. Think of it like this: if you want to know the average height of all students in your school, but you only measure 50 students, the average height of those 50 students is your estimate. The standard error tells you how close that estimate probably is to the real average height of all students in the school.
When we talk about the average (or mean) of a sample, we often use the term standard error of the mean. It helps us understand how reliable our sample average is as a guess for the average of the entire group. If the standard error is small, it means our sample average is likely very close to the true average of the whole group. If it's large, our sample average might be quite different.
We usually don't know the exact standard error for the whole group. So, we use the term standard error to mean a good guess based on the sample we have. The more measurements you take in your sample, the better your guess for the standard error will be.
Contents
How to Find the Standard Error
There are a couple of ways to figure out the standard error of the mean.
Using Many Samples
One way is to take many different samples from the whole group. For each sample, you find its average. Then, you look at all these sample averages and calculate their standard deviation. This standard deviation of all the sample averages is the standard error of the mean. This method can be a lot of work and might not always be possible.
Using One Sample and a Formula
A more common way to find the standard error of the mean is to use a special math formula that only needs one sample. Here's the formula:

Let's break down what the letters mean:
- s is the standard deviation of your sample. This number tells you how spread out the measurements are within your sample.
- n is the number of measurements you have in your sample. This is also called the sample size.
So, you take the standard deviation of your sample and divide it by the square root of how many measurements you have.
Generally, the more measurements you have in your sample (a bigger n), the smaller your standard error will be. This means your estimate is more accurate. A good rule of thumb is to have at least six measurements in your sample.
Why is Standard Error Useful?
Standard error is really helpful for a few reasons:
- More Measurements, More Certainty: If you want to be more sure about an average value, you can take more measurements in your sample. When you have more measurements, the standard error of the mean gets smaller. This is because you're dividing by a bigger number (the square root of n).
- How Many More Measurements? To make your uncertainty (standard error) half as big, you need to take four times as many measurements! To make it ten times smaller, you need one hundred times more measurements. This is because of the square root in the formula.
- Easy to Calculate: Standard errors are fairly easy to figure out.
- Confidence in Your Estimate: Knowing the standard error helps you understand how much you can trust your sample's average. It helps you create a "confidence interval," which is a range where the true average of the whole group is likely to be.
Relative Standard Error
The relative standard error (RSE) helps you understand how important the uncertainty is compared to the average itself. You find it by dividing the standard error by the average value. This number is usually less than one. If you multiply it by 100%, you get a percentage.
For example, imagine two surveys both find the average household income is $50,000.
- Survey 1 has a standard error of $10,000. Its relative standard error is ($10,000 / $50,000) = 0.20, or 20%.
- Survey 2 has a standard error of $5,000. Its relative standard error is ($5,000 / $50,000) = 0.10, or 10%.
Survey 2 is better because it has a smaller relative standard error. This means its measurement is more precise, and the uncertainty is smaller compared to the average income.
People who use average values often decide how small the uncertainty needs to be before they trust the information. For instance, some organizations won't report an average if the relative standard error is too high (like over 30%). They also often require a certain number of measurements (like at least 30) for an estimate to be reported.
Example: Redfish Weights
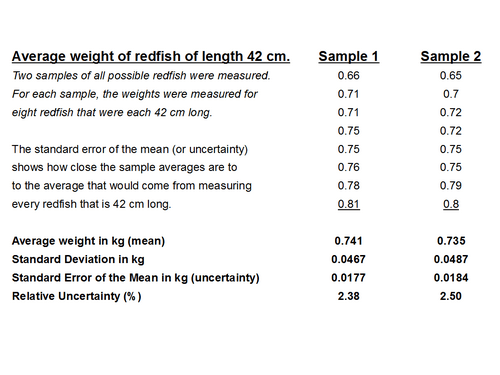
Let's say we want to know the average weight of a 42 cm long redfish in the Gulf of Mexico. It's impossible to weigh every single 42 cm redfish! So, we catch and weigh a sample of them.
Imagine we take two different samples of 42 cm redfish:
- Sample 1: The average weight is 0.741 kg.
- Sample 2: The average weight is 0.735 kg.
Notice that the averages are a little bit different between the two samples. This is normal! Each sample average will be slightly different from the true average weight of all 42 cm redfish.
The standard error helps us understand how close our sample average is to the true average. Using the formula, we can calculate the uncertainty for each sample. In this example, the uncertainties for both samples are very close to each other.
We can also find the relative uncertainty (relative standard error). For these redfish samples, the relative uncertainty is around 2.38% and 2.50%. This tells us that the uncertainty is quite small compared to the average weight.
Knowing the standard error helps us estimate a range where the true average for the whole group likely falls. For example, based on the first sample, we might expect the average weight for all 42 cm redfish in the Gulf of Mexico to be between 0.723 kg and 0.759 kg.
Related pages
See also
 In Spanish: Error estándar para niños
 | Aurelia Browder |
 | Nannie Helen Burroughs |
 | Michelle Alexander |


