
Normal distribution facts for kids
The normal distribution is a special kind of probability distribution. It is also known as the Gaussian distribution, named after Carl Friedrich Gauss, who first described it. This type of distribution is very important in many areas of science and math.
Normal distributions are a group of similar patterns that show how data can be spread out. They differ based on two main things: their location and their spread. The mean (or average) of the data tells you where the center of the distribution is. The standard deviation tells you how spread out the data is from that center. These two important numbers are shown by the symbols  (for the mean) and
  (for the standard deviation).
Contents
The Bell Curve Shape
The normal distribution is often called the bell curve because its graph looks like a bell. This shape is very common when you plot data from many real-world events. The highest point of the bell is at the mean, and the curve slopes down evenly on both sides.
The Standard Normal Distribution
A very special type of normal distribution is called the standard normal distribution. It is also known as the Z distribution. This one has a mean of zero and a standard deviation of one. You can see it as the green line in the pictures on the right. It's like a basic version that other normal distributions can be compared to.
Why is the Normal Distribution Important?
Many things in the world naturally follow a normal distribution. This happens because of something called the central limit theorem. This theorem basically says that if you add up many small, random events, the total result will often look like a normal distribution.
Here are some examples of things that often follow a normal distribution:
- The heights of people in a large group.
- Test scores on a big exam.
- Small errors that happen when you measure something.
- The brightness of certain types of light, like laser light.
- Some people believe that intelligence might be normally distributed, though it's hard to measure perfectly.
- Insurance companies use normal distributions to understand and predict average situations.
Related pages
Images for kids
-
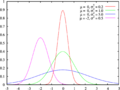
This graph shows the probability density function for the normal distribution. The green line is the standard normal distribution.
-
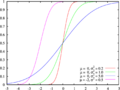
This graph shows the cumulative distribution function for the normal distribution. The colors match the image above.
-
As the number of separate events increases, the graph starts to look like a normal distribution.
-
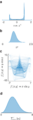
a: Probability density of a function \cos x^2 of a normal variable x with \mu=-2 and \sigma=3. b: Probability density of a function x^y of two normal variables x and y, where \mu_x=1, \mu_y=2, \sigma_x = 0.1, \sigma_y = 0.2, and \rho_{xy} = 0.8. c: Heat map of the joint probability density of two functions of two correlated normal variables x and y, where \mu_x = -2, \mu_y=5, \sigma_x^2 = 10, \sigma_y^2 = 20, and \rho_{xy} = 0.495. d: Probability density of a function \sum_{i=1}^4 \vert x_i \vert of 4 iid standard normal variables. These are computed by the numerical method of ray-tracing.
-
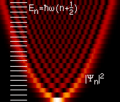
The lowest energy state of a quantum harmonic oscillator has a Gaussian (normal) distribution.
-

The bean machine, invented by Francis Galton, helps show how normal distributions work. Balls drop through pins and collect in bins, forming a bell curve shape.
-
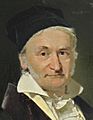
Carl Friedrich Gauss discovered the normal distribution in 1809.
-
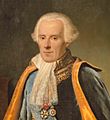
Pierre-Simon Laplace proved the central limit theorem in 1810, showing how important the normal distribution is in statistics.


See also
 In Spanish: Distribución normal para niños
