Median facts for kids
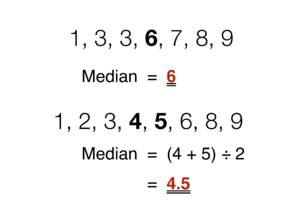
The median is a special number used in statistics and math. It's like the "middle" number in a list of data. When you arrange numbers from smallest to largest, the median is the one right in the middle. Half of the numbers are smaller than the median, and half are larger. It helps us understand the typical value in a group of numbers.
Contents
How to Find the Median
Finding the median is easy once you know the steps. First, you need to put all your numbers in order. Always arrange them from the smallest to the largest.
Finding the Median with Odd Numbers
If you have an odd number of values in your list, the median is simply the number exactly in the middle.
For example, imagine you have 5 numbers: 3, 7, 1, 9, 5.
- First, put them in order: 1, 3, 5, 7, 9.
- Since there are 5 numbers (an odd number), the middle one is the 3rd number.
- So, the median is 5. There are two numbers below 5 (1, 3) and two numbers above 5 (7, 9).
Finding the Median with Even Numbers
If you have an even number of values, there isn't one single middle number. In this case, the median is the average of the two middle numbers. To find the average, you add the two middle numbers together and then divide by 2.
For example, imagine you have 6 numbers: 10, 20, 5, 15, 25, 30.
- First, put them in order: 5, 10, 15, 20, 25, 30.
- Since there are 6 numbers (an even number), the two middle numbers are the 3rd and 4th ones. These are 15 and 20.
- Add them together: 15 + 20 = 35.
- Divide by 2: 35 / 2 = 17.5.
- So, the median is 17.5.
Median Versus Mean
The median and the mean (or average) are both ways to find the "center" of a group of numbers. However, they are used differently and can give different results.
When to Use the Median
The median is very useful when your data has some very high or very low numbers. These extreme numbers are called "outliers." Outliers can greatly affect the mean, making it seem higher or lower than what most of the numbers are. The median is not affected by these outliers.
Jelly Bean Example
Let's look at an example with jelly beans to see the difference.
Imagine five friends have these numbers of jelly beans:
- Friend 1: 7 jelly beans
- Friend 2: 8 jelly beans
- Friend 3: 9 jelly beans
- Friend 4: 10 jelly beans
- Friend 5: 11 jelly beans
- To find the mean: Add them all up (7+8+9+10+11 = 45) and divide by the number of friends (5). The mean is 45 / 5 = 9 jelly beans.
- To find the median: Put them in order (7, 8, 9, 10, 11). The middle number is 9.
In this case, both the mean and the median are 9.
Now, let's imagine a different group of five friends:
- Friend 1: 8 jelly beans
- Friend 2: 8 jelly beans
- Friend 3: 9 jelly beans
- Friend 4: 10 jelly beans
- Friend 5: 50 jelly beans (This friend has a lot more!)
- To find the mean: Add them all up (8+8+9+10+50 = 85) and divide by the number of friends (5). The mean is 85 / 5 = 17 jelly beans.
- To find the median: Put them in order (8, 8, 9, 10, 50). The middle number is still 9.
See the difference? In the second example, the mean (17) is much higher because of the one friend with 50 jelly beans. It doesn't really tell you how many jelly beans most people have. The median (9) still gives you a good idea of what the typical number of jelly beans is for most friends.
So, if you want to know the "typical" value without being pulled by extreme numbers, the median is a better choice. If you want to divide things equally among everyone, the mean is better.
See also
 In Spanish: Mediana (estadística) para niños
 | Aurelia Browder |
 | Nannie Helen Burroughs |
 | Michelle Alexander |


