Cottonwood, South Dakota facts for kids
Quick facts for kids
Cottonwood, South Dakota
|
|
|---|---|

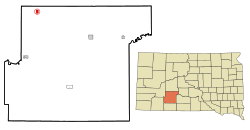
Location in Jackson County and the state of South Dakota
|
|
| Country | United States |
| State | South Dakota |
| County | Jackson |
| Incorporated | 1906 |
| Area | |
| • Total | 0.92 sq mi (2.38 km2) |
| • Land | 0.92 sq mi (2.38 km2) |
| • Water | 0.00 sq mi (0.00 km2) |
| Elevation | 2,415 ft (736 m) |
| Population
(2020)
|
|
| • Total | 12 |
| • Density | 13.07/sq mi (5.05/km2) |
| Time zone | UTC-7 (Mountain (MST)) |
| • Summer (DST) | UTC-6 (MDT) |
| Area code(s) | 605 |
| FIPS code | 46-14220 |
| GNIS feature ID | 1267339 |
Cottonwood is a very small place, almost like a tiny village, in Jackson County, South Dakota, United States. In 2020, only 12 people lived there. It's so small that it doesn't have any stores or services.
Contents
History of Cottonwood
Cottonwood was first started in 1906. Back then, it had a different name: Ingham. It was later renamed Cottonwood because of a nearby creek called Cottonwood Creek.
In 2016, the people living in Cottonwood had a vote. They decided if their town should continue to exist or if it should be dissolved. The residents voted 7 to 4 to keep their town going!
Where is Cottonwood?
Cottonwood is located in South Dakota. It covers a total area of about 2.38 square kilometers (or 0.92 square miles). All of this area is land, meaning there are no lakes or large rivers within the town's boundaries.
Weather in Cottonwood
Cottonwood experiences a wide range of weather throughout the year. Summers can be very hot, with record temperatures reaching up to 117 degrees Fahrenheit (47 degrees Celsius). Winters are very cold, with record lows dropping to -43 degrees Fahrenheit (-41 degrees Celsius).
The area gets some rain, especially in late spring and early summer. It also gets snow during the colder months.
| Climate data for Cottonwood 2 E, South Dakota (1991–2020 normals, extremes 1909–present) | |||||||||||||
|---|---|---|---|---|---|---|---|---|---|---|---|---|---|
| Month | Jan | Feb | Mar | Apr | May | Jun | Jul | Aug | Sep | Oct | Nov | Dec | Year |
| Record high °F (°C) | 80 (27) |
80 (27) |
88 (31) |
95 (35) |
105 (41) |
114 (46) |
117 (47) |
113 (45) |
108 (42) |
98 (37) |
85 (29) |
77 (25) |
117 (47) |
| Mean maximum °F (°C) | 58.4 (14.7) |
63.1 (17.3) |
76.3 (24.6) |
83.7 (28.7) |
90.9 (32.7) |
98.0 (36.7) |
103.8 (39.9) |
103.6 (39.8) |
100.1 (37.8) |
88.3 (31.3) |
72.8 (22.7) |
60.5 (15.8) |
105.5 (40.8) |
| Mean daily maximum °F (°C) | 33.1 (0.6) |
37.0 (2.8) |
47.6 (8.7) |
57.8 (14.3) |
68.3 (20.2) |
79.4 (26.3) |
88.2 (31.2) |
87.6 (30.9) |
78.2 (25.7) |
61.8 (16.6) |
47.1 (8.4) |
35.7 (2.1) |
60.2 (15.7) |
| Daily mean °F (°C) | 20.6 (−6.3) |
23.8 (−4.6) |
34.0 (1.1) |
43.9 (6.6) |
55.1 (12.8) |
66.0 (18.9) |
73.7 (23.2) |
71.7 (22.1) |
61.6 (16.4) |
46.6 (8.1) |
33.2 (0.7) |
23.0 (−5.0) |
46.1 (7.8) |
| Mean daily minimum °F (°C) | 8.1 (−13.3) |
10.5 (−11.9) |
20.4 (−6.4) |
30.0 (−1.1) |
42.0 (5.6) |
52.7 (11.5) |
59.2 (15.1) |
55.8 (13.2) |
45.0 (7.2) |
31.3 (−0.4) |
19.2 (−7.1) |
10.2 (−12.1) |
32.0 (0.0) |
| Mean minimum °F (°C) | −16.9 (−27.2) |
−13.8 (−25.4) |
−1.9 (−18.8) |
13.2 (−10.4) |
25.3 (−3.7) |
39.9 (4.4) |
47.0 (8.3) |
42.8 (6.0) |
30.2 (−1.0) |
12.7 (−10.7) |
−0.9 (−18.3) |
−12.4 (−24.7) |
−23.4 (−30.8) |
| Record low °F (°C) | −42 (−41) |
−43 (−42) |
−33 (−36) |
−12 (−24) |
13 (−11) |
30 (−1) |
34 (1) |
27 (−3) |
10 (−12) |
−14 (−26) |
−29 (−34) |
−41 (−41) |
−43 (−42) |
| Average precipitation inches (mm) | 0.41 (10) |
0.56 (14) |
1.03 (26) |
1.96 (50) |
2.90 (74) |
3.09 (78) |
2.10 (53) |
1.63 (41) |
1.22 (31) |
1.46 (37) |
0.54 (14) |
0.48 (12) |
17.38 (441) |
| Average snowfall inches (cm) | 5.4 (14) |
6.3 (16) |
6.3 (16) |
6.8 (17) |
0.4 (1.0) |
0.0 (0.0) |
0.0 (0.0) |
0.0 (0.0) |
0.0 (0.0) |
2.2 (5.6) |
4.8 (12) |
6.0 (15) |
38.2 (97) |
| Average precipitation days (≥ 0.01 in) | 4.6 | 5.1 | 5.7 | 8.6 | 10.0 | 11.9 | 8.9 | 6.6 | 5.2 | 6.7 | 4.5 | 4.4 | 82.2 |
| Average snowy days (≥ 0.1 in) | 4.0 | 4.2 | 3.2 | 2.4 | 0.1 | 0.0 | 0.0 | 0.0 | 0.0 | 0.9 | 2.7 | 3.8 | 21.3 |
| Source: NOAA | |||||||||||||
Who Lives in Cottonwood?
Cottonwood's population has changed a lot over the years. In the 1930s, it had almost 200 people. But since then, the number of residents has become much smaller.
| Historical population | |||
|---|---|---|---|
| Census | Pop. | %± | |
| 1920 | 121 | — | |
| 1930 | 191 | 57.9% | |
| 1940 | 118 | −38.2% | |
| 1950 | 102 | −13.6% | |
| 1960 | 38 | −62.7% | |
| 1970 | 16 | −57.9% | |
| 1980 | 4 | −75.0% | |
| 1990 | 12 | 200.0% | |
| 2000 | 6 | −50.0% | |
| 2010 | 9 | 50.0% | |
| 2020 | 12 | 33.3% | |
| U.S. Decennial Census 2012 Estimate |
|||
Census Information from 2010
In 2010, there were 9 people living in Cottonwood, spread across 6 homes. About half of these homes were families. Most of the people living there were White, and a small number were Native American.
The average age of people in Cottonwood in 2010 was about 60 years old. Most residents were between 45 and 64 years old. There were no residents under 18 at that time.
See also
 In Spanish: Cottonwood (Dakota del Sur) para niños
 | Laphonza Butler |
 | Daisy Bates |
 | Elizabeth Piper Ensley |

