East Laurinburg, North Carolina facts for kids
Quick facts for kids
East Laurinburg, North Carolina
|
|
|---|---|

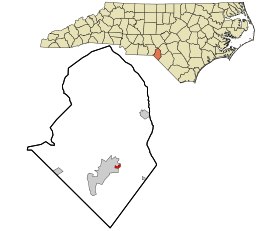
Location in Scotland County and the state of North Carolina.
|
|
| Country | United States |
| State | North Carolina |
| County | Scotland |
| Incorporated | 1909 (revoked) |
| Area | |
| • Total | 0.19 sq mi (0.50 km2) |
| • Land | 0.19 sq mi (0.50 km2) |
| • Water | 0.00 sq mi (0.00 km2) |
| Elevation | 210 ft (64 m) |
| Population
(2020)
|
|
| • Total | 234 |
| • Density | 1,218.75/sq mi (470.34/km2) |
| Time zone | UTC-5 (Eastern (EST)) |
| • Summer (DST) | UTC-4 (EDT) |
| ZIP code |
28352
|
| Area codes | 910, 472 |
| FIPS code | 37-19620 |
| GNIS feature ID | 1020084 |
East Laurinburg is a small place in Scotland County, North Carolina, in the United States. It's called an "unincorporated community" now. This means it's not officially a town with its own local government anymore.
In 2020, about 345 people lived here. East Laurinburg used to be a town, but its official status was removed in 2022 because of money problems. Now, it's managed by Scotland County.
Contents
History of East Laurinburg
How East Laurinburg Started
East Laurinburg began as a town called Scotland Village in 1903. It was located in the southern part of Scotland County. A few years later, in 1909, its name was changed to East Laurinburg.
The Waverly Mills and Workers' Lives
Early in its history, a big textile mill called Waverly Mills opened in East Laurinburg. This mill made fabrics and was very important for the area. Many homes, churches, and stores grew up around the mill.
The people who worked at the mill often lived in special housing provided by the company. They lived a bit separately from the people in the nearby town of Laurinburg. Sometimes, there were disagreements, like when East Laurinburg children had trouble enrolling in Laurinburg schools.
The Mill Workers' Strike
In May 1934, about 500 workers from the Waverly Mills went on strike. They were unhappy with their working conditions and the housing provided by the company. The strike became a big news story across the state.
The workers and mill management eventually agreed to talk things over. After 44 days, the strike ended. The company promised to make improvements, like fixing the plumbing in the workers' homes.
Changes Over Time
East Laurinburg's population was largest in 1940, with 890 residents. After that, the number of people living there slowly went down.
Later, the town faced financial difficulties. It stopped sending required reports to the state government. In 2021, an audit found some money problems. Because of these issues, the state decided that East Laurinburg could no longer be an official town. On July 1, 2022, it became an unincorporated part of Scotland County.
Geography
East Laurinburg is located in North Carolina. It covers a small area of about 0.5 square kilometers (0.2 square miles). All of this area is land.
A major road, U.S. Route 74, and a train track both pass through the community.
Population Information
How Many People Live Here?
The number of people living in East Laurinburg has changed a lot over the years. Here's a look at the population at different times:
| Historical population | |||
|---|---|---|---|
| Census | Pop. | %± | |
| 1910 | 577 | — | |
| 1920 | 541 | −6.2% | |
| 1930 | 813 | 50.3% | |
| 1940 | 890 | 9.5% | |
| 1950 | 745 | −16.3% | |
| 1960 | 695 | −6.7% | |
| 1970 | 487 | −29.9% | |
| 1980 | 536 | 10.1% | |
| 1990 | 302 | −43.7% | |
| 2000 | 295 | −2.3% | |
| 2010 | 300 | 1.7% | |
| 2020 | 345 | 15.0% | |
| U.S. Decennial Census | |||
A Look at the People in 2000
In the year 2000, there were 295 people living in East Laurinburg. These people lived in 124 households, and 81 of those were families.
The population density was about 1,620 people per square mile. This means a lot of people lived in a small space.
Most of the people were White (83.05%). There were also African American (5.76%), Native American (8.81%), and Asian (1.36%) residents. Some people (1.02%) were from two or more racial backgrounds. About 1.36% of the population was Hispanic or Latino.
Households and Families
Out of the 124 households, about 20% had children under 18 living there. About 40% were married couples living together. Some households (18.5%) had a female head of the house with no spouse. About 31.5% of all households were single individuals.
The average household had 2.38 people, and the average family had 2.99 people.
Age Groups
The population was spread out across different age groups:
- 21.0% were under 18 years old.
- 10.2% were between 18 and 24.
- 23.7% were between 25 and 44.
- 25.1% were between 45 and 64.
- 20.0% were 65 years old or older.
The average age of people in East Laurinburg was 43 years.
Income Information
In 2000, the average income for a household in East Laurinburg was $25,938 per year. For families, the average income was $31,875 per year.
About 22.9% of all people and 24.1% of families lived below the poverty line. This included about 30.9% of children under 18 and 9.7% of people 65 or older.
See also
 In Spanish: East Laurinburg para niños

