El Tarra facts for kids
Quick facts for kids
El Tarra
|
||
|---|---|---|
|
Municipality and town
|
||
 |
||
|
||

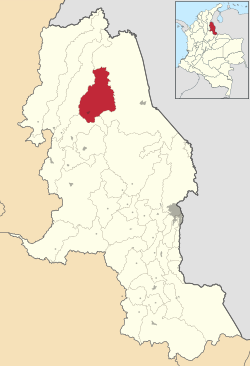
Location of the municipality and town of El Tarra in the Norte de Santander Department of Colombia.
|
||
| Country | ||
| Department | Norte de Santander Department | |
| Area | ||
| • Total | 687 km2 (265 sq mi) | |
| Elevation | 160 m (520 ft) | |
| Population
(2015)
|
||
| • Total | 10,957 | |
| • Density | 15.949/km2 (41.31/sq mi) | |
| Time zone | UTC-5 (Colombia Standard Time) | |
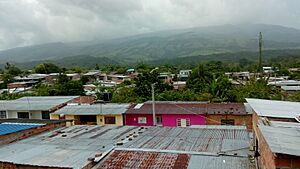
El Tarra is a town and a municipality in Colombia. It is located in the Norte de Santander Department. A municipality is like a local government area. El Tarra is known for its warm climate and beautiful natural surroundings.
Contents
Exploring El Tarra: A Colombian Town
El Tarra is a small but important place in Colombia. It is part of the Norte de Santander Department, which is in the northeastern part of the country. The town is located at an elevation of about 160 meters (525 feet) above sea level.
What is a Municipality?
In Colombia, a municipality is a local area with its own government. It includes a main town or city and the surrounding rural areas. El Tarra is both a town and the center of its municipality. This means it has its own mayor and local council.
How Many People Live There?
As of 2015, about 10,957 people lived in El Tarra. This number includes people living in the main town and those in the countryside nearby. The total area of the municipality is about 687 square kilometers (265 square miles).
El Tarra's Climate: Warm and Rainy
El Tarra has a very warm climate all year round. This is because it is located close to the Equator. The temperatures stay pretty much the same throughout the year.
Temperatures in El Tarra
The average temperature in El Tarra is around 27 degrees Celsius (81 degrees Fahrenheit). The highest temperatures are usually around 32 degrees Celsius (90 degrees Fahrenheit). Even at night, it stays warm, with lows around 20 degrees Celsius (68 degrees Fahrenheit).
Rainfall in El Tarra
El Tarra gets a lot of rain, especially from April to November. The wettest months are usually October and November. During these months, it can rain more than 300 millimeters (12 inches). Even in the drier months, there is still some rain. This makes the area very green and lush.
| Climate data for El Tarra (Tarra El), elevation 180 m (590 ft), (1981–2010) | |||||||||||||
|---|---|---|---|---|---|---|---|---|---|---|---|---|---|
| Month | Jan | Feb | Mar | Apr | May | Jun | Jul | Aug | Sep | Oct | Nov | Dec | Year |
| Mean daily maximum °C (°F) | 31.7 (89.1) |
31.7 (89.1) |
31.8 (89.2) |
32.0 (89.6) |
32.2 (90.0) |
32.3 (90.1) |
32.5 (90.5) |
32.4 (90.3) |
32.5 (90.5) |
32.4 (90.3) |
31.8 (89.2) |
31.7 (89.1) |
32.1 (89.8) |
| Daily mean °C (°F) | 26.8 (80.2) |
27.0 (80.6) |
26.6 (79.9) |
27.2 (81.0) |
27.5 (81.5) |
27.5 (81.5) |
27.5 (81.5) |
27.5 (81.5) |
27.5 (81.5) |
27.4 (81.3) |
26.8 (80.2) |
26.7 (80.1) |
27.2 (81.0) |
| Mean daily minimum °C (°F) | 20.1 (68.2) |
20.4 (68.7) |
20.7 (69.3) |
21.1 (70.0) |
21.2 (70.2) |
20.8 (69.4) |
20.7 (69.3) |
20.7 (69.3) |
20.7 (69.3) |
20.7 (69.3) |
20.5 (68.9) |
20.4 (68.7) |
20.7 (69.3) |
| Average precipitation mm (inches) | 85.9 (3.38) |
84.7 (3.33) |
123.4 (4.86) |
179.1 (7.05) |
181.0 (7.13) |
194.1 (7.64) |
211.3 (8.32) |
233.5 (9.19) |
288.9 (11.37) |
314.2 (12.37) |
361.4 (14.23) |
295.6 (11.64) |
2,355.1 (92.72) |
| Average precipitation days | 6 | 6 | 9 | 13 | 12 | 12 | 14 | 15 | 16 | 18 | 17 | 15 | 141 |
| Average relative humidity (%) | 82 | 80 | 81 | 80 | 80 | 80 | 79 | 79 | 79 | 79 | 81 | 81 | 80 |
| Source: Instituto de Hidrologia Meteorologia y Estudios Ambientales | |||||||||||||
See also
 In Spanish: El Tarra para niños
 | Emma Amos |
 | Edward Mitchell Bannister |
 | Larry D. Alexander |
 | Ernie Barnes |


