
Great Migration (African American) facts for kids
| Part of the Nadir of American race relations | |

United States map of the Black American population from the 1900 U.S. census
|
|
| Date | 1910s–1970 |
|---|---|
| Location | United States |
| Also known as | Great Northward Migration Black Migration |
| Cause | Poor economic conditions More job opportunities in the North Racial segregation in the United States:
|
| Participants | About 6,000,000 Black Americans |
| Outcome | Demographic shifts across the U.S. Improved living conditions for Black Americans |
The Great Migration was a huge movement of about six million Black Americans. Between 1910 and 1970, they moved from the rural Southern United States to cities in the Northeast, Midwest, and West. This happened because of very unfair economic and social conditions in the South. There were many rules, called Jim Crow laws, that separated people and treated Black Americans badly. They also faced serious dangers and violence. Many Black Americans moved to find better jobs and safer lives.
This big move changed America a lot. Most migrants went to major cities like New York City, Chicago, and Los Angeles. In these cities, Black Americans built strong communities and created new cultural movements. Historian Isabel Wilkerson called this migration a "declaration of independence." It showed how people took action to change their own lives and American history.
For a long time, most Black Americans lived in the South. In 1910, over 90% lived there. But by the end of the Great Migration, about half lived in the North and West. Also, Black Americans became much more urban. In 1900, only one-fifth of Black Americans in the South lived in cities. By 1970, over 80% nationwide lived in cities.
Nicholas Lemann described the Great Migration as one of the biggest movements of people inside a country ever. It was not caused by war or hunger. It was larger than the migrations of many other groups to the U.S. For Black people, it meant finding a new home and new opportunities.
Historians often divide the Great Migration into two parts. The first was from 1910 to 1940, with about 1.6 million people moving. The second was from 1940 to 1970, with at least five million more moving after the Great Depression.
Since the Civil rights movement, this trend has changed. More Black Americans are now moving back to the South. This is called the New Great Migration. It's happening because of better job growth in the "New South" and lower living costs. Also, there's less unfair treatment and stronger family ties there now.
Contents
- Why People Moved: The Causes of the Great Migration
- The First Wave: 1910–1940
- The Second Wave: 1940s–1970
- Where People Went: Migration Patterns
- New Ideas and Art: Cultural Changes
- What Changed: Effects of the Migration
- Southern Reactions to the Migration
- The Chicago Defender's Role
- Statistics
- The New Great Migration
- Images for kids
- See also
Why People Moved: The Causes of the Great Migration

Black Americans in the South faced many challenges. These included unfair rules that separated people, forced labor systems, and a rise in racist ideas. There was also widespread violence and a lack of good jobs or social chances.
At the same time, the North offered new hope. During World War I, many European immigrants stopped coming to the U.S. This created a shortage of workers in Northern factories. Thousands of jobs opened up in places like steel mills, railroads, and car factories. Northern companies even sent people to the South to recruit Black workers. They offered special help, like free travel and affordable housing.
Northern jobs often paid much more than Southern jobs. In the South, many Black farmers worked under a system called sharecropping, which was often unfair. There were also problems like a bad economy for farming and insect infestations that ruined cotton crops. All these issues made people want to leave. The lack of political power and social opportunities in the South, controlled by Jim Crow laws, also pushed Black Americans to seek a better life elsewhere.
The First Wave: 1910–1940
Before 1863, most Black Americans lived in the South. By 1900, about 90% still did. But this began to change. Between 1910 and 1930, the Black American population in Northern states grew by about 40%. This growth was mostly in big cities.
Cities like Philadelphia, Detroit, Chicago, Cleveland, Baltimore, and New York City saw the biggest increases. Many Black workers found industrial jobs, for example, working on the Pennsylvania Railroad. However, these cities also attracted millions of European immigrants. This led to competition for jobs and housing, causing some tensions.
Migration Continues
The number of Black Americans leaving the South grew steadily. By 1930, 1.3 million former Southerners lived in other regions.
The Great Depression in the 1930s slowed down migration. Jobs became scarce, especially for Black Americans. But in the 1930s and 1940s, new machines in farming ended the sharecropping system. This forced many Black farmers off their land.
So, about 1.4 million Black Southerners moved North or West in the 1940s. Another 1.1 million moved in the 1950s, and 2.4 million more in the 1960s and early 1970s. By the late 1970s, as factories closed in some Northern cities, the Great Migration ended. Later, in the 1980s and 1990s, more Black Americans started moving back South. This was due to better economies there and the end of Jim Crow laws.
Black Americans moved from states like Alabama, Mississippi, Louisiana, Texas, and Georgia.
The Second Wave: 1940s–1970
The Great Depression had slowed migration. But with the start of World War II and the good economy afterward, migration picked up again. Even more Black Americans left the South through the 1960s.
This new wave of migration often led to crowded cities. This was partly because of rules that made it hard for Black families to find homes in some developing suburbs. For example, in New York and New Jersey, many home loans were given out, but very few went to non-white families.
Where People Went: Migration Patterns
Big cities were the main destinations during both parts of the Great Migration. In the first part, cities like New York, Chicago, Philadelphia, and Detroit attracted most migrants. The second wave added more destinations, especially in the Western states. Cities like Los Angeles, San Francisco, Oakland, and Seattle also saw many Black Americans arrive.


There were clear paths people followed. For example, almost half of those from Mississippi went to Chicago. People from Virginia often moved to Philadelphia. These patterns were sometimes based on geography, with people moving to the closest big cities. Other times, it was "chain migration," where people followed family and friends who had moved before them.
Black Americans also moved to industrial cities within the South. For example, Louisville saw its defense industries grow during World War II. Factories made things like synthetic rubber and vehicle parts. Many industries changed to make products for the war.
During the war, there was a shortage of workers. Black Americans took these jobs. At first, many jobs were not open to them. But with the growing need for workers and new rules for fair hiring, Southern industries began to accept Black Americans.
New Ideas and Art: Cultural Changes
Moving to Northern cities inspired Black Americans to be creative. The Great Migration helped start the Harlem Renaissance in New York and the Chicago Black Renaissance. These were periods of amazing growth in Black art, music, and literature.
Journalist Isabel Wilkerson wrote about how six million Black Southerners moved away from the unfair Jim Crow laws to new, sometimes uncertain, lives.
Artist Jacob Lawrence created his famous Migration Series paintings about this journey. These paintings showed the struggles and hopes of migrants. They made him one of the most important Black American artists of his time.
The Great Migration also changed music. Many blues singers moved from the Mississippi Delta to Chicago to escape unfair treatment. Famous blues artists like Muddy Waters and Buddy Guy made Chicago a center for blues music. Pianist Eddie Boyd said that moving to Chicago was "a hell of a lot better than down there where I was born."
What Changed: Effects of the Migration
Population Shifts: Demographic Changes
The Great Migration greatly reduced the number of Black people living in the rural South. This changed the population makeup of many states. For example, in 1910, Black Americans were the majority in South Carolina and Mississippi. By 1970, only Mississippi had more than 30% Black residents.
In Mississippi, the Black population dropped from 56% in 1910 to 37% by 1970. In Georgia, it went from 45% to 26%. In South Carolina, it fell from 55% to 30%.
Meanwhile, the number of Black Americans outside the South grew a lot. In 1900, only 8% of the nation's Black population lived outside the South. By 1970, this was 47%, or over 10.6 million people.
Because migrants settled in big cities, their influence grew there. Cities that were mostly white became centers of Black culture and politics. Rules like "redlining" often forced Black people into crowded neighborhoods. But these "Black metropolises" developed strong communities with newspapers, businesses, churches, and political groups. These became important places for new Black culture and politics.
For example, Detroit's Black population grew from 6,000 in 1910 to 120,000 by 1929. Chicago's Black population grew from 278,000 to 813,000 between 1940 and 1960. Cleveland also saw a big increase, from 1.6% Black residents to 4.3% by 1920. Other cities like Philadelphia, New York City, and Baltimore also saw huge growth.

Challenges and Opportunities: Discrimination and Working Conditions
Educated Black Americans often found better jobs after the migration. They gained more social mobility. However, migrants still faced a lot of unfair treatment. Many urban white workers, including recent immigrants, sometimes felt threatened by the new Black workers. They worried about job competition.
Black Americans made big gains in factory jobs, especially in steel, cars, and meatpacking. Between 1910 and 1920, the number of Black factory workers almost doubled. After the Great Depression, labor unions like the Congress of Industrial Organizations (CIO) helped. These unions ended job separation, and Black Americans moved into more skilled and supervisory roles.
Between 1940 and 1960, the number of Black people in management jobs doubled. The percentage of Black families living in poverty also dropped a lot, from 87% in 1940 to 30% by 1970.
However, rapid population growth led to housing shortages in most big cities. Black Americans were often limited to older, more run-down housing due to unfair rules. Rules like "redlining" made it hard for Black migrants to buy homes or get fair prices.

In places like Albany, New York, migrants found poor living conditions but also higher wages and better schools. Local groups and churches helped them. In Pittsburgh, Black people faced unfair treatment but built strong communities. They formed migration clubs, shared money, and moved in groups. They discussed the pros and cons of moving to the North.
Living Together: Integration and Segregation
In cities like Newark, New York, and Chicago, Black Americans became more involved in society. This period changed many Black Americans from rural farmers to city factory workers.
This migration led to a cultural boom. In Chicago, the Bronzeville neighborhood became known as the "Black Metropolis." It was a place where Black entrepreneurs thrived. The first Black American YMCA was founded there, helping migrants find jobs.
However, cultural differences sometimes created a feeling of "otherness." Stereotypes often came from the rural traditions that migrants kept in their new city homes.
Locals also built Black-owned businesses like bars, hotels, and churches. The Bethel African Methodist Episcopal Church was one of these. Soloman and Cordelia Johnson founded it in the late 1890s. Black locals could freely express their religious beliefs there, and it became a cultural center. The Hotel Robinson, founded by Albert and Margaret Robinson after gaining their freedom, is another example. It opened in Julian in 1887 and is still active today as the Julian Hotel. It was the first Black-owned business in San Diego.
Southern Reactions to the Migration
The Great Migration showed a strange situation in the South. Even though Black people faced extreme unfairness, the Southern economy relied heavily on them for cheap labor. Black workers were seen as key to the South's economic growth. One politician said, "Politically speaking, there are far too many negroes, but from an industrial standpoint there is room for many more."
When the migration began in the 1910s, some white Southern leaders didn't worry. They thought it would remove extra workers. But as more people left, they started to panic. They feared a long exodus would harm the South's economy. Newspapers warned of the danger.
White employers eventually noticed and tried to stop the flow of workers. Some even tried to improve living conditions and reduce unfair treatment to make Black people stay.
When these efforts failed, white Southerners, along with federal officials, tried to force Black people to stay. They feared Black people wanting more rights. Some steel manufacturers refused to cash checks for migration. Efforts were made to limit bus and train access for Black Americans. Rules were put in place to restrict movement, like "work or fight" laws. Some Black people even faced threats or violence to make them stay. The Secretary of Labor called these tactics an interference with "the natural right of workers to move from place to place."
During the migration wave in the 1940s, white Southerners were less concerned. New machines in farming had created another surplus of workers, so planters resisted less.
Black Americans were not the only group to leave the South for Northern jobs. Many poor white people from Appalachia also moved to the Midwest and Northeast after World War II. This was known as the Hillbilly Highway.
The Chicago Defender's Role
The Chicago Defender newspaper played a big part in encouraging Black Americans to leave the South. The paper used strong headlines and cartoons to show Black Southerners the better jobs and chances in the North. It often called the North a "promised land." The Defender was a Black-owned newspaper that highlighted racism and discrimination, along with Black social and economic progress.
The newspaper not only encouraged migration but also listed job openings and train schedules. May 15, 1975, was even called the "Great Northern Drive." This led to at least 110,000 Black Americans moving to Chicago alone. The paper also fought for racial justice, pushing for anti-violence laws and publishing famous Black writers. The Defender helped build communities for new Black migrants, starting new social, political, and religious movements. Many Black Americans who moved to Chicago saw the Defender as a trusted guide.
Statistics
| Region | 1900 | 1910 | 1920 | 1930 | 1940 | 1950 | 1960 | 1970 | 1980 | Change in the Black Percentage of the Total Population Between 1900 and 1980 |
|---|---|---|---|---|---|---|---|---|---|---|
| 11.6% | 10.7% | 9.9% | 9.7% | 9.8% | 10.0% | 10.5% | 11.1% | 11.7% | +0.1% | |
| Northeast | 1.8% | 1.9% | 2.3% | 3.3% | 3.8% | 5.1% | 6.8% | 8.9% | 9.9% | +8.1% |
| Midwest | 1.9% | 1.8% | 2.3% | 3.3% | 3.5% | 5.0% | 6.7% | 8.1% | 9.1% | +7.2% |
| South | 32.3% | 29.8% | 26.9% | 24.7% | 23.8% | 21.7% | 20.6% | 19.1% | 18.6% | -13.7% |
| West | 0.7% | 0.7% | 0.9% | 1.0% | 1.2% | 2.9% | 3.9% | 4.9% | 5.2% | +4.5% |
| State | Region | 1900 | 1910 | 1920 | 1930 | 1940 | 1950 | 1960 | 1970 | 1980 | Change in the Black Percentage of the Total Population Between 1900 and 1980 |
|---|---|---|---|---|---|---|---|---|---|---|---|
| N/A | 11.6% | 10.7% | 9.9% | 9.7% | 9.8% | 10.0% | 10.5% | 11.1% | 11.7% | +0.1% | |
| South | 45.2% | 42.5% | 38.4% | 35.7% | 34.7% | 32.0% | 30.0% | 26.2% | 25.6% | -19.6% | |
| West | 0.3% | 0.3% | 0.2% | 0.2% | 0.2% | 3.0% | 3.0% | 3.4% | +3.1% | ||
| West | 1.5% | 1.0% | 2.4% | 2.5% | 3.0% | 3.5% | 3.3% | 3.0% | 2.8% | +1.3% | |
| South | 28.0% | 28.1% | 27.0% | 25.8% | 24.8% | 22.3% | 21.8% | 18.3% | 16.3% | -11.2% | |
| West | 0.7% | 0.9% | 1.1% | 1.4% | 1.8% | 4.4% | 5.6% | 7.0% | 7.7% | +6.0% | |
| West | 1.6% | 1.4% | 1.2% | 1.1% | 1.1% | 1.5% | 2.3% | 3.0% | 3.5% | +1.9% | |
| Northeast | 1.7% | 1.4% | 1.5% | 1.8% | 1.9% | 2.7% | 4.2% | 6.0% | 7.0% | +6.3% | |
| South | 16.6% | 15.4% | 13.6% | 13.7% | 13.5% | 13.7% | 13.6% | 14.3% | 16.1% | -0.5% | |
| South | 31.1% | 28.5% | 25.1% | 27.1% | 28.2% | 35.0% | 53.9% | 71.1% | 70.3% | +38.2% | |
| South | 43.7% | 41.0% | 34.0% | 29.4% | 27.1% | 21.8% | 17.8% | 15.3% | 13.8% | -29.9% | |
| South | 46.7% | 45.1% | 41.7% | 36.8% | 34.7% | 30.9% | 28.5% | 25.9% | 26.8% | -16.2% | |
| West | 0.2% | 0.4% | 0.1% | 0.2% | 0.1% | 0.5% | 0.8% | 1.0% | 1.8% | +1.6% | |
| West | 0.2% | 0.2% | 0.2% | 0.2% | 0.1% | 0.2% | 0.2% | 0.3% | 0.3% | +0.1% | |
| Midwest | 1.8% | 1.9% | 2.8% | 4.3% | 4.9% | 7.4% | 10.3% | 12.8% | 14.7% | +12.9% | |
| Midwest | 2.3% | 2.2% | 2.8% | 3.5% | 3.6% | 4.4% | 5.8% | 6.9% | 7.6% | +5.3% | |
| Midwest | 0.6% | 0.7% | 0.8% | 0.7% | 0.7% | 0.8% | 0.9% | 1.2% | 1.4% | +1.2% | |
| Midwest | 3.5% | 3.2% | 3.3% | 3.5% | 3.6% | 3.8% | 4.2% | 4.8% | 5.3% | +1.8% | |
| South | 13.3% | 11.4% | 9.8% | 8.6% | 7.5% | 6.9% | 7.1% | 7.2% | 7.1% | -6.2% | |
| South | 47.1% | 43.1% | 38.9% | 36.9% | 35.9% | 32.9% | 31.9% | 29.8% | 29.4% | -17.7% | |
| Northeast | 0.2% | 0.2% | 0.2% | 0.1% | 0.2% | 0.1% | 0.3% | 0.3% | 0.3% | +0.1% | |
| South | 19.8% | 17.9% | 16.9% | 16.9% | 16.6% | 16.5% | 16.7% | 17.8% | 22.7% | +2.9% | |
| Northeast | 1.1% | 1.1% | 1.2% | 1.2% | 1.3% | 1.6% | 2.2% | 3.1% | 3.9% | +2.8% | |
| Midwest | 0.7% | 0.6% | 1.6% | 3.5% | 4.0% | 6.9% | 9.2% | 11.2% | 12.9% | +12.2% | |
| Midwest | 0.3% | 0.3% | 0.4% | 0.4% | 0.4% | 0.5% | 0.7% | 0.9% | 1.3% | +1.0% | |
| South | 58.5% | 56.2% | 52.2% | 50.2% | 49.2% | 45.3% | 42.0% | 36.8% | 35.2% | -23.3% | |
| Midwest | 5.2% | 4.8% | 5.2% | 6.2% | 6.5% | 7.5% | 9.0% | 10.3% | 10.5% | +5.3% | |
| West | 0.6% | 0.2% | 0.3% | 0.2% | 0.2% | 0.2% | 0.2% | 0.3% | 0.2% | -0.4% | |
| Midwest | 0.6% | 0.6% | 1.0% | 1.0% | 1.1% | 1.5% | 2.1% | 2.7% | 3.1% | +2.5% | |
| West | 0.3% | 0.6% | 0.4% | 0.6% | 0.6% | 2.7% | 4.7% | 5.7% | 6.4% | +6.1% | |
| Northeast | 0.2% | 0.1% | 0.1% | 0.2% | 0.1% | 0.1% | 0.3% | 0.3% | 0.4% | +0.2% | |
| Northeast | 3.7% | 3.5% | 3.7% | 5.2% | 5.5% | 6.6% | 8.5% | 10.7% | 12.6% | +9.9% | |
| West | 0.8% | 0.5% | 1.6% | 0.7% | 0.9% | 1.2% | 1.8% | 1.9% | 1.8% | +1.0% | |
| Northeast | 1.4% | 1.5% | 1.9% | 3.3% | 4.2% | 6.2% | 8.4% | 11.9% | 13.7% | +12.3% | |
| South | 33.0% | 31.6% | 29.8% | 29.0% | 27.5% | 25.8% | 24.5% | 22.2% | 22.4% | -10.6% | |
| West | 0.1% | 0.1% | 0.1% | 0.1% | 0.0% | 0.0% | 0.1% | 0.4% | 0.4% | +0.3% | |
| Midwest | 2.3% | 2.3% | 3.2% | 4.7% | 4.9% | 6.5% | 8.1% | 9.1% | 10.0% | +7.7% | |
| South | 7.0% | 8.3% | 7.4% | 7.2% | 7.2% | 6.5% | 6.6% | 6.7% | 6.8% | -0.2% | |
| West | 0.3% | 0.2% | 0.3% | 0.2% | 0.2% | 0.8% | 1.0% | 1.3% | 1.4% | +1.1% | |
| Northeast | 2.5% | 2.5% | 3.3% | 4.5% | 4.7% | 6.1% | 7.5% | 8.6% | 8.8% | +6.3% | |
| Northeast | 2.1% | 1.8% | 1.7% | 1.4% | 1.5% | 1.8% | 2.1% | 2.7% | 2.9% | +0.8% | |
| South | 58.4% | 55.2% | 51.4% | 45.6% | 42.9% | 38.8% | 34.8% | 30.5% | 30.4% | -28.0% | |
| West | 0.1% | 0.1% | 0.1% | 0.1% | 0.1% | 0.1% | 0.2% | 0.2% | 0.3% | +0.2% | |
| South | 23.8% | 21.7% | 19.3% | 18.3% | 17.4% | 16.1% | 16.5% | 15.8% | 15.8% | -8.0% | |
| South | 20.4% | 17.7% | 15.9% | 14.7% | 14.4% | 12.7% | 12.4% | 12.5% | 12.0% | -8.0% | |
| West | 0.2% | 0.3% | 0.3% | 0.2% | 0.2% | 0.4% | 0.5% | 0.6% | 0.6% | +0.4% | |
| Northeast | 0.2% | 0.5% | 0.2% | 0.2% | 0.1% | 0.1% | 0.1% | 0.2% | 0.2% | +0.0% | |
| South | 35.6% | 32.6% | 29.9% | 26.8% | 24.7% | 22.1% | 20.6% | 18.5% | 18.9% | -16.7% | |
| West | 0.5% | 0.5% | 0.5% | 0.4% | 0.4% | 1.3% | 1.7% | 2.1% | 2.6% | +2.1% | |
| South | 4.5% | 5.3% | 5.9% | 6.6% | 6.2% | 5.7% | 4.8% | 3.9% | 3.3% | -1.2% | |
| Midwest | 0.1% | 0.1% | 0.2% | 0.4% | 0.4% | 0.8% | 1.9% | 2.9% | 3.9% | +3.8% | |
| West | 1.0% | 1.5% | 0.7% | 0.6% | 0.4% | 0.9% | 0.7% | 0.8% | 0.7% | -0.3% |
| City | 1900 | 1910 | 1920 | 1930 | 1940 | 1950 | 1960 | 1970 | 1980 | 1990 | Change in the Black Percentage of the Total Population Between 1900 and 1990 |
|---|---|---|---|---|---|---|---|---|---|---|---|
| Phoenix, Arizona | 2.7% | 2.9% | 3.7% | 4.9% | 6.5% | 4.9% | 4.8% | 4.8% | 4.8% | 5.2% | +2.5% |
| Los Angeles, California | 2.1% | 2.4% | 2.7% | 3.1% | 4.2% | 8.7% | 13.5% | 17.9% | 17.0% | 14.0% | +11.9% |
| San Diego, California | 1.8% | 1.5% | 1.3% | 1.8% | 2.0% | 4.5% | 6.0% | 7.6% | 8.9% | 9.4% | +7.6% |
| San Francisco, California | 0.5% | 0.4% | 0.5% | 0.6% | 0.8% | 5.6% | 10.0% | 13.4% | 12.7% | 10.9% | +10.4% |
| San Jose, California | 1.0% | 0.6% | 0.5% | 0.4% | 0.4% | 0.6% | 1.0% | 2.5% | 4.6% | 4.7% | +3.7% |
| Denver, Colorado | 2.9% | 2.5% | 2.4% | 2.5% | 2.4% | 3.6% | 6.1% | 9.1% | 12.0% | 12.8% | +9.9% |
| Washington, District of Columbia | 31.1% | 28.5% | 25.1% | 27.1% | 28.2% | 35.0% | 53.9% | 71.1% | 70.3% | 65.8% | +34.7% |
| Chicago, Illinois | 1.8% | 2.0% | 4.1% | 6.9% | 8.2% | 13.6% | 22.9% | 32.7% | 39.8% | 39.1% | +37.3% |
| Indianapolis, Indiana | 9.4% | 9.3% | 11.0% | 12.1% | 13.2% | 15.0% | 20.6% | 18.0% | 21.8% | 22.6% | +13.2% |
| Baltimore, Maryland | 15.6% | 15.2% | 14.8% | 17.7% | 19.3% | 23.7% | 34.7% | 46.4% | 54.8% | 59.2% | +43.6% |
| Boston, Massachusetts | 2.1% | 2.0% | 2.2% | 2.6% | 3.1% | 5.0% | 9.1% | 16.3% | 22.4% | 25.6% | +23.5% |
| Detroit, Michigan | 1.4% | 1.2% | 4.1% | 7.7% | 9.2% | 16.2% | 28.9% | 43.7% | 63.1% | 75.7% | +74.3% |
| Minneapolis, Minnesota | 0.8% | 0.9% | 1.0% | 0.9% | 0.9% | 1.3% | 2.4% | 4.4% | 7.7% | 13.0% | +12.2% |
| Kansas City, Missouri | 10.7% | 9.5% | 9.5% | 9.6% | 10.4% | 12.2% | 17.5% | 22.1% | 27.4% | 29.6% | +18.9% |
| St. Louis, Missouri | 6.2% | 6.4% | 9.0% | 11.4% | 13.3% | 17.9% | 28.6% | 40.9% | 45.6% | 47.5% | +41.3% |
| Buffalo, New York | 0.5% | 0.4% | 0.9% | 2.4% | 3.1% | 6.3% | 13.3% | 20.4% | 26.6% | 30.7% | +30.2% |
| New York, New York | 1.8% | 1.9% | 2.7% | 4.7% | 6.1% | 9.5% | 14.0% | 21.1% | 25.2% | 28.7% | +26.9% |
| Cincinnati, Ohio | 4.4% | 5.4% | 7.5% | 10.6% | 12.2% | 15.5% | 21.6% | 27.6% | 33.8% | 37.9% | +33.5% |
| Cleveland, Ohio | 1.6% | 1.5% | 4.3% | 8.0% | 9.6% | 16.2% | 28.6% | 38.3% | 43.8% | 46.6% | +45.0% |
| Columbus, Ohio | 6.5% | 7.0% | 9.4% | 11.3% | 11.7% | 12.4% | 16.4% | 18.5% | 22.1% | 22.6% | +16.1% |
| Philadelphia, Pennsylvania | 4.8% | 5.5% | 7.4% | 11.3% | 13.0% | 18.2% | 26.4% | 33.6% | 37.8% | 39.9% | +35.1% |
| Pittsburgh, Pennsylvania | 5.3% | 4.8% | 6.4% | 8.2% | 9.3% | 12.2% | 16.7% | 20.2% | 24.0% | 25.8% | +20.5% |
| Seattle, Washington | 0.5% | 1.0% | 0.9% | 0.9% | 1.0% | 3.4% | 4.8% | 7.1% | 9.5% | 10.1% | +9.6% |
| Milwaukee, Wisconsin | 0.3% | 0.3% | 0.5% | 1.3% | 1.5% | 3.4% | 8.4% | 14.7% | 23.1% | 30.5% | +30.2% |
| City | 1900 | 1910 | 1920 | 1930 | 1940 | 1950 | 1960 | 1970 | 1980 | 1990 | Change in the Black Percentage of the Total Population Between 1900 and 1990 |
|---|---|---|---|---|---|---|---|---|---|---|---|
| Jacksonville, Florida | 57.1% | 50.8% | 45.3% | 37.2% | 35.7% | 35.4% | 41.1% | 22.3% | 25.4% | 25.2% | -31.9% |
| New Orleans, Louisiana | 27.1% | 26.3% | 26.1% | 28.3% | 30.1% | 31.9% | 37.2% | 45.0% | 55.3% | 61.9% | +34.8% |
| Memphis, Tennessee | 48.8% | 40.0% | 37.7% | 38.1% | 41.5% | 37.2% | 37.0% | 38.9% | 47.6% | 54.8% | +6.0% |
| Dallas, Texas | 21.2% | 19.6% | 15.1% | 14.9% | 17.1% | 13.1% | 19.0% | 24.9% | 29.4% | 29.5% | +8.3% |
| El Paso, Texas | 2.9% | 3.7% | 1.7% | 1.8% | 2.3% | 2.4% | 2.1% | 2.3% | 3.2% | 3.4% | +0.5% |
| Houston, Texas | 32.7% | 30.4% | 24.6% | 21.7% | 22.4% | 20.9% | 22.9% | 25.7% | 27.6% | 28.1% | -4.6% |
| San Antonio, Texas | 14.1% | 11.1% | 8.9% | 7.8% | 7.6% | 7.0% | 7.1% | 7.6% | 7.3% | 7.0% | -7.1% |
The New Great Migration
After the political and civil gains of the Civil rights movement, in the 1970s, migration began to increase again. It moved in a different direction, as Black people who were searching for economic opportunity traveled to new regions of the South.
The New Great Migration is not evenly spread throughout the South. Like the earlier Great Migration, it is mainly directed toward cities and large urban areas. These include Atlanta, Charlotte, Houston, Dallas, Raleigh, Washington, D.C., Tampa, Virginia Beach, San Antonio, Memphis, Orlando, Nashville, and Jacksonville.
North Carolina's Charlotte metro area, in particular, is a popular spot for Black American migrants. Between 1975 and 1980, Charlotte saw a net gain of 2,725 Black Americans. This number continued to rise, with a net gain of 7,497 between 1985 and 1990, and 23,313 from 1995 to 2000. This shows that Atlanta, Charlotte, Dallas, and Houston are growing hotspots for migrants in the New Great Migration.
The percentage of Black Americans living in the South has been increasing since 1990. The biggest gains have been in the region's large urban areas, according to census data. The Black population of metro Atlanta more than doubled between 1990 and 2020, reaching over 2 million. The Black population also more than doubled in metro Charlotte. Greater Houston and Dallas-Fort Worth both saw their Black populations surpass 1 million for the first time.
Several smaller metro areas also saw big gains. These include San Antonio; Raleigh and Greensboro, N.C.; and Orlando. The main destinations are states with the most job opportunities. These are especially Georgia, North Carolina, Maryland, Virginia, Tennessee, Florida, and Texas. Other Southern states, like Mississippi, Louisiana, South Carolina, Alabama, and Arkansas, have seen little growth in their Black American populations from this return migration.
Images for kids
-
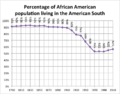
Graph showing the percentage of the African-American population living in the American South, 1790–2010
-
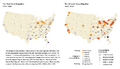
The Great Migration shown by changes in the African-American share of populations of major U.S. cities, 1910–40 and 1940–70
-
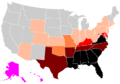
A map of the black percentage of the U.S. population by each state/territory in 1900.
Black = 35.0+%
Brown = 20.0–34.9%
Red = 10.0–19.9%
Orange = 5.0–9.9%
Light orange = 1.0–4.9%
Gray = 0.9% or less
Magenta = No data available -

A map of the black percentage of the U.S. population by each state/territory in 1990.
Black = 35.0+%
Brown = 20.0–34.9%
Red = 10.0–19.9%
Orange = 5.0–9.9%
Light orange = 1.0–4.9%
Gray = 0.9% or less
Pink = No data available -
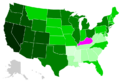
A map showing the change in the total Black population (in percent) between 1900 and 1990 by U.S. state.
Light purple = Population decline
Very light green = Population growth of 0.1–9.9%
Light green = Population growth of 10.0–99.9%
Green = Population growth of 100.0–999.9%
Dark green = Population growth of 1,000.0–9,999.9%
Very dark green (or Black) = Population growth of 10,000.0% or more
Gray = No data available


See also
 In Spanish: Gran Migración Afroamericana para niños
- African-American history
- Exodusters
- Black homesteaders
- Go Tell It on the Mountain (novel)
- Hillbilly Highway
- Historical racial and ethnic demographics of the United States
- History of African Americans in Chicago
- Living for the City
- The Migration Series
- White backlash#United States
- White flight#United States
