
Log-log graph facts for kids
Log-log graphs are special types of charts where both the x-axis (the horizontal one) and the y-axis (the vertical one) use a logarithmic scale instead of a regular, straight (linear) scale. Think of it like a ruler where the spaces between numbers get smaller as the numbers get bigger. These graphs are super useful in many areas of science and math to show and understand data, especially when numbers change a lot.
Contents
What are Log-Log Graphs?
A log-log graph is a way to plot data where both the horizontal and vertical axes are scaled logarithmically. This means that equal distances on the axis represent equal *ratios* or *multiples*, rather than equal *amounts*. For example, the distance from 1 to 10 might be the same as the distance from 10 to 100, or from 100 to 1000.
Linear vs. Logarithmic Scales
To understand log-log graphs, it helps to know the difference between linear and logarithmic scales.
Linear Scales
On a linear scale, numbers are spaced out evenly. If you have a ruler, the distance between 1 and 2 is the same as the distance between 2 and 3, and so on. This is great for showing data where values change by similar amounts. For example, if you're tracking your height growth each year, a linear graph works well.
Logarithmic Scales
A logarithmic scale is different. The numbers are not spaced evenly. Instead, the distance between 1 and 10 is the same as the distance between 10 and 100, or 100 and 1000. This is because each step represents a multiplication (like by 10) rather than an addition. Logarithmic scales are perfect for showing data that covers a very wide range of values, or data that grows by multiplying.
Why Use Log-Log Graphs?
Log-log graphs are powerful tools for several reasons:
- Showing Wide Ranges: Sometimes, data points can range from very small numbers (like 0.001) to very large numbers (like 1,000,000). A linear graph would make it hard to see the small values, or the graph would be too big. A log-log graph can fit all these numbers clearly.
- Finding Relationships: Many natural and scientific relationships follow a "power law." This means one quantity changes as a power of another (like y = x² or y = x³). When you plot these relationships on a log-log graph, they often turn into a straight line. This makes it much easier to see the pattern and understand the relationship between the data.
- Simplifying Complex Data: If you have data that looks like a curve on a regular graph, it might become a straight line on a log-log graph. A straight line is much easier to analyze and predict from. Scientists and engineers use this to understand things like how fast populations grow, how earthquakes are distributed, or how signals decay over distance.
Where are Log-Log Graphs Used?
You can find log-log graphs used in many different fields:
- Science: In physics, they help analyze how light intensity changes with distance. In biology, they can show how an animal's metabolism scales with its body size.
- Engineering: Engineers use them to design electronic circuits or understand how materials behave under stress.
- Economics: They can show how income distribution works or how stock prices change over long periods.
- Computer Science: They are used to analyze the performance of algorithms, especially when dealing with very large amounts of data.
By turning curved data into straight lines, log-log graphs help us spot trends, make predictions, and understand the underlying rules of how things work in the world around us.
Images for kids
-
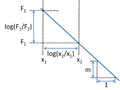
Finding the slope of a log–log plot using ratios

See also
 In Spanish: Representación logarítmica para niños
