
Logarithmic scale facts for kids
A logarithmic scale is a special way to measure things. We use it when the numbers we are measuring cover a very wide range. Imagine trying to show tiny numbers and huge numbers on the same regular ruler! A logarithmic scale makes this much easier.
Instead of adding a fixed amount each time (like 1, 2, 3, 4), a logarithmic scale works by multiplying. This means each step on the scale is the previous step multiplied by a constant number. For example, a scale might go 1, 10, 100, 1000. Each step is 10 times bigger than the last.
This type of scale helps us understand data that changes a lot. It squishes a huge range of values into a smaller, more manageable space.
Our senses, like hearing, often work in a similar way. For example, our ears hear sounds that are twice as loud as having a constant difference in how loud they seem. This is why logarithmic scales are great for measuring things like sound.

Contents
What are Logarithmic Scales Used For?
Logarithmic scales are very useful in many areas of science and everyday life. They help us measure things that change by huge amounts.
Some common uses include:
- Measuring the strength of earthquakes with the Richter scale.
- Measuring how loud sounds are using decibels.
- Measuring the brightness of stars.
- Measuring the pH of solutions, which tells us how acidic or basic something is.
- Understanding how fast epidemics spread.
How Do They Work?
Think about a regular ruler. The distance between 1 and 2 is the same as the distance between 2 and 3. This is a linear scale.
On a logarithmic scale, the distance between 1 and 10 might be the same as the distance between 10 and 100. This is because each step represents a multiplication, not an addition. This makes it easy to see big changes.
For example, if you have a graph showing something that grows very quickly, like the number of internet users over many years, a logarithmic scale can show all the data clearly. On a regular graph, the early years might look flat, and the later years would shoot off the top!
Examples of Logarithmic Scales
Here are some well-known examples where logarithmic scales are used:
Measuring Earthquakes
- The Richter scale and moment magnitude scale (MMS) measure the strength of earthquakes. A magnitude 7 earthquake is 10 times stronger than a magnitude 6 earthquake. This scale helps scientists compare very different sized quakes.
Measuring Sound and Power
- The decibel (dB) and neper are used for measuring sound loudness and electric power. A sound that is 10 dB louder is actually 10 times more powerful. This matches how our ears hear sound.
Photography Exposure
- In photography, f-stops are used to measure how much light enters the camera. Each f-stop doubles or halves the amount of light. This is a logarithmic relationship.
Probability and Reliability
- Sometimes, very low probabilities are described by "nines." For example, a system that fails with a probability of 1 in 100,000 (0.00001) is called "five nines" reliable (99.999%). This is a simple way to talk about very small chances.
Acidity (pH)
- The pH scale measures how acidic or basic a liquid is. A pH of 7 is neutral (like pure water). A pH of 6 is 10 times more acidic than 7, and a pH of 5 is 100 times more acidic. Lower numbers mean more acidic.
Star Brightness
- The stellar magnitude scale measures how bright stars appear from Earth. A smaller number means a brighter star. For example, a magnitude 1 star is much brighter than a magnitude 6 star.
Logarithmic Graphs
Before computers, scientists used special paper called logarithmic graph paper.
- If you plot data on paper with one logarithmic scale and one regular scale (called a semilog graph), things that grow exponentially (like population growth) will appear as a straight line.
- If you use paper with logarithmic scales on both sides (called a log-log graph), things that follow a power law (like how much energy an object has based on its speed) will also appear as a straight line. This makes it easy to see patterns in data.
Images for kids
-
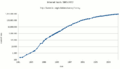
Semi-log plot of the Internet host count over time shown on a logarithmic scale
-
Map of the solar system and distance to Alpha Centauri using a logarithmic scale.


See also
 In Spanish: Escala logarítmica para niños
