
Murraysville, North Carolina facts for kids
Quick facts for kids
Murraysville, North Carolina
|
|
|---|---|

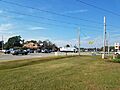
Central junction in Murrayville at Murrayville Road and North Carolina Highway 132
|
|

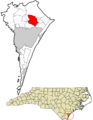
Location in New Hanover County and the state of North Carolina.
|
|
| Country | United States |
| State | North Carolina |
| County | New Hanover |
| Area | |
| • Total | 8.69 sq mi (22.50 km2) |
| • Land | 8.61 sq mi (22.31 km2) |
| • Water | 0.07 sq mi (0.19 km2) |
| Elevation | 33 ft (10 m) |
| Population
(2020)
|
|
| • Total | 16,582 |
| • Density | 1,925.01/sq mi (743.24/km2) |
| Time zone | UTC-5 (Eastern (EST)) |
| • Summer (DST) | UTC-4 (EDT) |
| FIPS code | 37-45720 |
| GNIS feature ID | 2403320 |
Murraysville is a community in New Hanover County, North Carolina, United States. It is called a census-designated place (CDP). This means it is an area that the government counts for population statistics, but it is not an officially incorporated town or city.
In 2020, about 16,582 people lived in Murraysville. The community is part of the larger Wilmington area.
Contents
About Murraysville
Murraysville is located in the eastern part of North Carolina. It is close to the coast and the city of Wilmington. The area covers about 8.7 square miles (22.5 square kilometers) of land.
Population and People
| Historical population | |||
|---|---|---|---|
| Census | Pop. | %± | |
| 2020 | 16,582 | — | |
| U.S. Decennial Census | |||
The United States Census is a count of all people living in the country. It happens every ten years. The census helps us understand how many people live in different places and what groups they belong to.
Who Lives in Murraysville?
As of the 2020 United States census, there were 16,582 people living in Murraysville. These people lived in 6,646 households. A household is a group of people living together in one home.
Most people in Murraysville are White. There are also many Black or African American residents. Other groups include Asian, Native American, and people of mixed races. About 9% of the population is Hispanic or Latino.
| Race | Number | Percentage |
|---|---|---|
| White (non-Hispanic) | 11,886 | 71.68% |
| Black or African American (non-Hispanic) | 1,945 | 11.73% |
| Native American | 43 | 0.26% |
| Asian | 396 | 2.39% |
| Pacific Islander | 3 | 0.02% |
| Other/Mixed | 803 | 4.84% |
| Hispanic or Latino | 1,506 | 9.08% |
See also
 In Spanish: Murraysville para niños
Images for kids
-
Central junction in Murrayville at Murrayville Road and North Carolina Highway 132
-
Location of Murraysville in New Hanover County, North Carolina
