San José del Guaviare facts for kids
Quick facts for kids
San José del Guaviare
|
|||
|---|---|---|---|
|
Municipality and town
|
|||

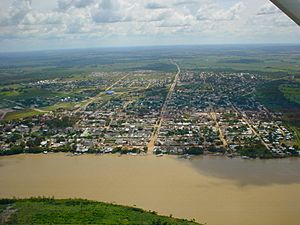
Aerial view of San José del Guaviare
|
|||
|
|||

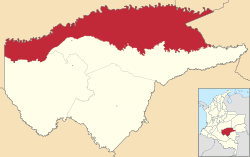
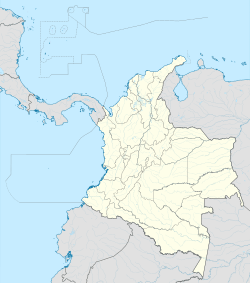
Location of the municipality and town of San José del Guaviare in the Guaviare Department of Colombia.
|
|||
| Country | |||
| Region | Amazon Region | ||
| Department | Guaviare Department | ||
| Founded | 1960 | ||
| Area | |||
| • Municipality and town | 16,769 km2 (6,475 sq mi) | ||
| • Urban | 6.17 km2 (2.38 sq mi) | ||
| Elevation | 185 m (607 ft) | ||
| Population
(2018 census)
|
|||
| • Municipality and town | 52,815 | ||
| • Density | 3.14956/km2 (8.1573/sq mi) | ||
| • Urban | 36,254 | ||
| • Urban density | 5,876/km2 (15,218/sq mi) | ||
| Demonym(s) | Guaviarenses | ||
| Time zone | UTC-05 (Colombia Standard Time) | ||
| Postal code |
950001-9
|
||
| Area code(s) | 57 + 9 | ||
| Climate | Am | ||
| Website | Official website: http://www.sanjosedelguaviare-guaviare.gov.co/ | ||
San José del Guaviare is an important town and municipality in Colombia. It is the capital city of the Guaviare Department. The town is located by the Guaviare River.
The area is also home to some of the Nunak people. These are indigenous groups who live in the region.
Understanding San José del Guaviare's Climate
San José del Guaviare has a tropical monsoon climate. This means it is warm all year round. It also has a lot of rain, especially during certain months.
The weather here is usually hot and humid. This type of climate supports a rich variety of plants and animals. It is typical for regions close to the Equator.
| Climate data for San José del Guaviare, elevation 165 m (541 ft), (1981–2010) | |||||||||||||
|---|---|---|---|---|---|---|---|---|---|---|---|---|---|
| Month | Jan | Feb | Mar | Apr | May | Jun | Jul | Aug | Sep | Oct | Nov | Dec | Year |
| Mean daily maximum °C (°F) | 33.4 (92.1) |
33.5 (92.3) |
32.9 (91.2) |
31.5 (88.7) |
30.7 (87.3) |
29.9 (85.8) |
29.7 (85.5) |
30.6 (87.1) |
31.5 (88.7) |
31.6 (88.9) |
31.5 (88.7) |
32.2 (90.0) |
31.6 (88.9) |
| Daily mean °C (°F) | 26.3 (79.3) |
26.7 (80.1) |
26.4 (79.5) |
25.9 (78.6) |
25.4 (77.7) |
24.7 (76.5) |
24.6 (76.3) |
25.1 (77.2) |
25.5 (77.9) |
25.7 (78.3) |
25.8 (78.4) |
26.1 (79.0) |
25.7 (78.3) |
| Mean daily minimum °C (°F) | 21.2 (70.2) |
21.4 (70.5) |
21.9 (71.4) |
22.4 (72.3) |
22.2 (72.0) |
21.9 (71.4) |
21.5 (70.7) |
21.6 (70.9) |
21.9 (71.4) |
22.2 (72.0) |
22.2 (72.0) |
21.7 (71.1) |
21.8 (71.2) |
| Average precipitation mm (inches) | 44.6 (1.76) |
94.0 (3.70) |
153.2 (6.03) |
319.7 (12.59) |
353.6 (13.92) |
355.0 (13.98) |
334.9 (13.19) |
273.1 (10.75) |
237.1 (9.33) |
235.4 (9.27) |
225.0 (8.86) |
99.9 (3.93) |
2,725.6 (107.31) |
| Average precipitation days | 6 | 8 | 13 | 19 | 21 | 24 | 22 | 21 | 17 | 17 | 16 | 10 | 188 |
| Average relative humidity (%) | 80 | 80 | 82 | 87 | 89 | 90 | 89 | 88 | 86 | 86 | 87 | 84 | 86 |
| Mean monthly sunshine hours | 189.1 | 155.3 | 139.5 | 120.0 | 102.3 | 96.0 | 114.7 | 133.3 | 156.0 | 155.0 | 150.0 | 164.3 | 1,675.5 |
| Mean daily sunshine hours | 6.1 | 5.5 | 4.5 | 4.0 | 3.3 | 3.2 | 3.7 | 4.3 | 5.2 | 5.0 | 5.0 | 5.3 | 4.6 |
| Source: Instituto de Hidrologia Meteorologia y Estudios Ambientales | |||||||||||||
| Climate data for San José del Guaviare (Trueno El), elevation 150 m (490 ft), (1981–2010) | |||||||||||||
|---|---|---|---|---|---|---|---|---|---|---|---|---|---|
| Month | Jan | Feb | Mar | Apr | May | Jun | Jul | Aug | Sep | Oct | Nov | Dec | Year |
| Mean daily maximum °C (°F) | 32.9 (91.2) |
33.5 (92.3) |
32.7 (90.9) |
31.4 (88.5) |
30.6 (87.1) |
29.8 (85.6) |
29.5 (85.1) |
30.6 (87.1) |
31.5 (88.7) |
31.6 (88.9) |
31.3 (88.3) |
31.6 (88.9) |
31.4 (88.5) |
| Daily mean °C (°F) | 26.2 (79.2) |
26.4 (79.5) |
26.0 (78.8) |
25.5 (77.9) |
25.0 (77.0) |
24.4 (75.9) |
24.1 (75.4) |
24.5 (76.1) |
25.0 (77.0) |
25.3 (77.5) |
25.3 (77.5) |
25.7 (78.3) |
25.3 (77.5) |
| Mean daily minimum °C (°F) | 20.8 (69.4) |
21.0 (69.8) |
21.7 (71.1) |
21.8 (71.2) |
21.7 (71.1) |
21.1 (70.0) |
20.8 (69.4) |
20.9 (69.6) |
21.1 (70.0) |
21.4 (70.5) |
21.5 (70.7) |
21.2 (70.2) |
21.2 (70.2) |
| Average precipitation mm (inches) | 58.7 (2.31) |
84.1 (3.31) |
193.6 (7.62) |
308.3 (12.14) |
377.2 (14.85) |
370.9 (14.60) |
350.1 (13.78) |
273.1 (10.75) |
239.3 (9.42) |
278.9 (10.98) |
208.6 (8.21) |
122.4 (4.82) |
2,762.1 (108.74) |
| Average precipitation days | 6 | 7 | 14 | 19 | 23 | 24 | 24 | 22 | 19 | 19 | 17 | 11 | 197 |
| Average relative humidity (%) | 79 | 79 | 83 | 89 | 90 | 90 | 90 | 90 | 88 | 87 | 89 | 85 | 87 |
| Mean monthly sunshine hours | 182.9 | 146.8 | 124.0 | 102.0 | 102.3 | 90.0 | 105.4 | 120.9 | 144.0 | 145.7 | 138.0 | 155.0 | 1,557 |
| Mean daily sunshine hours | 5.9 | 5.2 | 4.0 | 3.4 | 3.3 | 3.0 | 3.4 | 3.9 | 4.8 | 4.7 | 4.6 | 5.0 | 4.3 |
| Source: Instituto de Hidrologia Meteorologia y Estudios Ambientales | |||||||||||||
See also
 In Spanish: San José del Guaviare para niños
Black History Month on Kiddle
African-American Astronauts:
 | Stephanie Wilson |
 | Charles Bolden |
 | Ronald McNair |
 | Frederick D. Gregory |

All content from Kiddle encyclopedia articles (including the article images and facts) can be freely used under Attribution-ShareAlike license, unless stated otherwise. Cite this article:
San José del Guaviare Facts for Kids. Kiddle Encyclopedia.


