Student's t-test facts for kids
A t-test is a special tool in statistics that helps us compare numbers. Imagine you have two groups of things, like two groups of students or two types of plants. You measure something for each group, like their average test score or their average height. A t-test helps you figure out if the average number from one group is truly different from the average number of another group, or if the difference you see is just by chance.
For example, let's say you want to know if students who study with music do better on tests than students who study in silence. You could have one group study with music and another group study in silence. After the test, you'd find the average score for each group. A t-test would then help you decide if the difference in their average scores is big enough to say that studying with music really makes a difference.
This test is super useful when you don't know the exact "spread" or "variation" of the numbers in the whole group you're studying. Instead, you use the data you collected (your "sample") to estimate this spread. The t-test was created to handle this situation, making sure your comparison is fair even with these estimates.

Contents
What is a T-Test Used For?
A t-test helps scientists and researchers answer questions about averages. It's like asking: "Is the average of group A really different from the average of group B?" or "Is the average of my group different from a specific number I expect?"
Comparing Averages
The main use of a t-test is to compare the average (or "mean") of two groups.
- One-sample t-test: This is when you compare the average of one group to a known value. For example, if you know the average height of 12-year-olds is 150 cm, and you measure a group of students from a new school, you could use a t-test to see if their average height is different from 150 cm.
- Two-sample t-test: This is when you compare the averages of two different groups. Like comparing the average running speed of boys versus girls in a class.
When Do We Use It?
You use a t-test when you have a small number of samples, usually less than 30. It's also used when you don't know the exact "spread" of the data in the larger group (called the "population variance"). Instead, you have to estimate this spread from the data you've collected.
Real-Life Examples
- Medicine: Does a new medicine lower blood pressure more than an old one?
- Education: Do students who use a new teaching method score higher on tests?
- Sports: Is the average jump height of basketball players different from volleyball players?
Who Invented the T-Test?
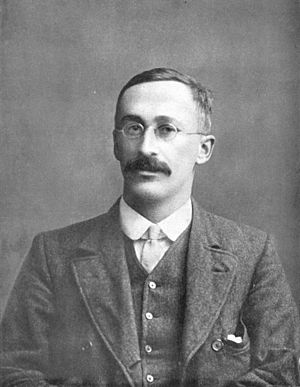
The t-test was developed by a clever person named William Sealy Gosset. He worked for the Guinness brewery in Dublin, Ireland, in the early 1900s. Guinness wanted to make sure their beer was always the same quality. Gosset needed a way to test small batches of ingredients without using up too much.
The Story of "Student"
Gosset published his work on the t-test in 1908. However, Guinness didn't want their trade secrets shared, so they didn't allow their employees to publish scientific papers under their real names. So, William Gosset used the pseudonym (a fake name) "Student" when he published his famous paper. That's why the t-test is sometimes called "Student's t-test"!
How Does a T-Test Work?
A t-test calculates a "t-value." This t-value tells you how much the averages of your groups differ, compared to how much the data within each group spreads out.
Understanding the T-Value
- A large t-value means there's a big difference between the averages of your groups. This suggests the difference is probably real and not just due to chance.
- A small t-value means the averages are very similar, or the data is very spread out. This suggests the difference might just be random.
After calculating the t-value, you compare it to a special table or use computer software. This helps you decide if the difference you see is "statistically significant." This means it's very unlikely to have happened by chance.
See also
 In Spanish: Prueba t de Student para niños
 | Ernest Everett Just |
 | Mary Jackson |
 | Emmett Chappelle |
 | Marie Maynard Daly |

