
Čelinac facts for kids
Quick facts for kids
Čelinac
Челинац
|
|||
|---|---|---|---|
|
Town and municipality
|
|||

View on Čelinac
|
|||
|
|||

Location of Čelinac within Bosnia and Herzegovina
|
|||
 |
|||
| Country | |||
| Entity | |||
| Area | |||
| • Total | 361.81 km2 (139.70 sq mi) | ||
| Population
(2013 census)
|
|||
| • Total | 15,548 | ||
| • Density | 42.9728/km2 (111.299/sq mi) | ||
| Time zone | UTC+1 (CET) | ||
| • Summer (DST) | UTC+2 (CEST) | ||
| Area code(s) | 051 | ||

.svg)

Čelinac (Serbian Cyrillic: Челинац) is a town and a municipality in Republika Srpska, which is part of Bosnia and Herzegovina. In 2013, the whole municipality had about 15,548 people living there. The town of Čelinac itself had a population of 5,097 people.
Contents
Exploring Čelinac: Geography
Čelinac is located along two rivers, the Jošavka and the Vrbanja. It sits between several other municipalities. To the north, you'll find Laktaši and Prnjavor. To the east is Teslić. South of Čelinac are Kotor Varoš and Kneževo. Finally, to the west, you'll find the larger city of Banja Luka.
A Look Back: History of Čelinac
Times of Change and Conflict
During the 1990s, the area of Čelinac, like many parts of Bosnia and Herzegovina, experienced a difficult period known as the Bosnian War. This conflict led to many changes for the people living in the region.
Local authorities during this time introduced rules that affected different groups of people. For example, some rules limited when certain groups could be outside or gather together. These rules were put in place during a time of great tension and conflict.
These events are part of the historical records and have been discussed in international courts. They show how the war deeply impacted the daily lives of people in Čelinac and the wider region.
Villages and Towns: Settlements
Besides the main town of Čelinac, the municipality includes many other smaller communities. Here is a list of these settlements:
- Balte
- Basići
- Branešci Donji
- Branešci Gornji
- Brezičani
- Crni Vrh
- Čelinac Gornji
- Dubrava Nova
- Dubrava Stara
- Grabovac
- Jošavka Donja
- Jošavka Gornja
- Kablovi
- Kamenica
- Lađevci
- Lipovac
- Markovac
- Mehovci
- Memići
- Miloševo
- Opsječko
- Popovac
- Skatavica
- Šahinovići
- Šnjegotina Donja
- Šnjegotina Srednja
- Šnjegotina Velika
- Štrbe
- Vijačani Gornji
Who Lives Here: Demographics
Population Changes Over Time
The number of people living in Čelinac municipality has changed over the years. Here's a look at the population in different settlements from 1971 to 2013:
| Population of settlements – Čelinac municipality | |||||
|---|---|---|---|---|---|
| Settlement | 1971. | 1981. | 1991. | 2013. | |
| Total | 17,430 | 18,354 | 18,713 | 15,117 | |
| 1 | Balte | 234 | 141 | ||
| 2 | Basići | 237 | 27 | ||
| 3 | Branešci Gornji | 645 | 375 | ||
| 4 | Branešci Donji | 779 | 555 | ||
| 5 | Brezičani | 517 | 393 | ||
| 6 | Vijačani Gornji | 544 | 362 | ||
| 7 | Grabovac | 648 | 568 | ||
| 8 | Dubrava Nova | 13 | 24 | ||
| 9 | Dubrava Stara | 771 | 614 | ||
| 10 | Jošavka Gornja | 563 | 441 | ||
| 11 | Jošavlka Donja | 957 | 746 | ||
| 12 | Kablovi | 294 | 118 | ||
| 13 | Kamenica | 28 | 38 | ||
| 14 | Lađevci | 527 | 303 | ||
| 15 | Lipovac | 308 | 119 | ||
| 16 | Markovac | 167 | 161 | ||
| 17 | Memići | 218 | 118 | ||
| 18 | Mehovci | 266 | 7 | ||
| 19 | Miloševo | 359 | 322 | ||
| 20 | Opsječko | 950 | 1,180 | ||
| 21 | Popovac | 306 | 144 | ||
| 22 | Skatavica | 149 | 70 | ||
| 23 | Crni Vrh | 756 | 520 | ||
| 24 | Čelinac | 1,321 | 3,136 | 4,857 | 5,097 |
| 25 | Čelinac Gornji | 513 | 514 | ||
| 26 | Šahinovići | 170 | 104 | ||
| 27 | Šnjegotina Velika | 836 | 534 | ||
| 28 | Šnjegotina Donja | 572 | 326 | ||
| 29 | Šnjegotina Srednja | 922 | 583 | ||
| 30 | Štrbe | 605 | 613 | ||
Population by Nationality in Čelinac Town
This table shows the different nationalities living in the town of Čelinac over the years:
| Population by Nationality – Čelinac town | ||||
|---|---|---|---|---|
| Nationality | 2013. | 1991. | 1981. | 1971. |
| Total | 5.097 (100%) | 4.857 (100%) | 3.136 (100%) | 1.321 (100%) |
| Serbs | 3.450 (71,0%) | 1.798 (57,3%) | 569 (43,1%) | |
| Bosniaks | 1.005 (20,7%) | 817 (26,1%) | 694 (52,5%) | |
| Croats | 51 (1,1%) | 57 (1,8%) | 32 (2,4%) | |
| Yugoslavs | 234 (4,8%) | 402 (12,8%) | 7 (0,5%) | |
| Others | 117 (2,4%) | 62 (2,0%) | 19 (1,4%) | |
Population by Nationality in Čelinac Municipality
This table shows the different nationalities living in the entire Čelinac municipality:
| Population by Nationality – Čelinac municipality | ||||
|---|---|---|---|---|
| Nationality | 2013. | 1991. | 1981. | 1971. |
| Total | 15.117 (100%) | 18.713 (100%) | 18.354 (100%) | 17.430 (100%) |
| Serbs | 14.508 (96,0%) | 16.554 (88,5%) | 15.832 (86,3%) | 15.880 (91,1%) |
| Bosniaks | 395 (2,6%) | 1.446 (7,7%) | 1.232 (6,7%) | 1.209 (6,9%) |
| Croats | 48 (0,3%) | 76 (0,4%) | 86 (0,5%) | 90 (0,5%) |
| Yugoslavs | 377 (2,0%) | 885 (4,8%) | 14 (0,1%) | |
| Others | 166 (1,1%) | 260 (1,4%) | 319 (1,7%) | 237 (1,4%) |
Working in Čelinac: Economy
The economy of Čelinac involves many different types of jobs. Here's a look at how many people were working in different fields in 2016:
| Professional field | Total |
|---|---|
| Agriculture, forestry and fishing | 94 |
| Mining and quarrying | - |
| Manufacturing | 1,123 |
| Distribution of power, gas, steam and air-conditioning | 49 |
| Distribution of water and water waste management | 25 |
| Construction | 85 |
| Wholesale and retail, repair | 534 |
| Transportation and storage | 175 |
| Hotels and restaurants | 105 |
| Information and communication | 12 |
| Finance and insurance | 18 |
| Real estate activities | 2 |
| Professional, scientific and technical activities | 43 |
| Administrative and support services | 76 |
| Public administration and defence | 132 |
| Education | 253 |
| Healthcare and social work | 91 |
| Art, entertainment and recreation | 12 |
| Other service activities | 42 |
| Total | 2,871 |
Famous Faces: Notable People
Some well-known people have come from Čelinac, including:
- Radoslav Brđanin, a politician
- Rajko Kuzmanović, also a politician
- Željko Blagojević, an ultra runner
Images for kids
-
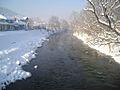
The Vrbanja river
-
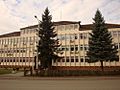
The town assembly building
-
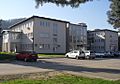
The Community Health centre
-
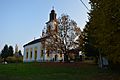
A Church in Jošavka Donja
-
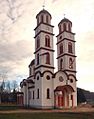
The Serbian Orthodox Church of St. Archangel Gabriel
-
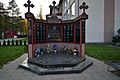
Monument dedicated to the fighters of Republika Srpska

.jpg)

_-_panoramio.jpg)

_01_-_panoramio.jpg)
See also
 In Spanish: Čelinac para niños
