1868 United Kingdom general election facts for kids
|
||||||||||||||||||||||||||||||||||
|
|
||||||||||||||||||||||||||||||||||
|
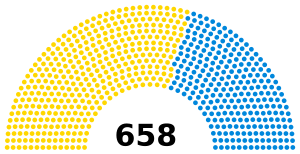
All 658 seats in the House of Commons 327 seats needed for a majority |
||||||||||||||||||||||||||||||||||
|---|---|---|---|---|---|---|---|---|---|---|---|---|---|---|---|---|---|---|---|---|---|---|---|---|---|---|---|---|---|---|---|---|---|---|
|
||||||||||||||||||||||||||||||||||
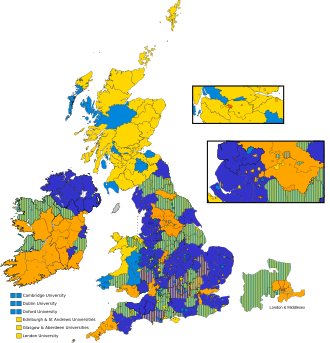
Colours denote the winning party
|
||||||||||||||||||||||||||||||||||
|
||||||||||||||||||||||||||||||||||
The 1868 United Kingdom general election was a big event in British history. It was the first election after a new law called the Reform Act 1867 was passed. This law allowed many more men to vote than ever before. Before this, only a few wealthy men could vote.
Because of the new law, nearly three times as many people voted in 1868 compared to the previous election in 1865. This was the first time more than a million votes were cast in a UK election!
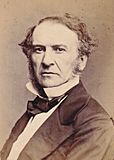
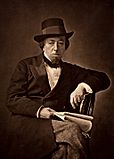
The election was a contest between two main political parties: the Liberal Party, led by William Gladstone, and the Conservative Party, led by Benjamin Disraeli. The Liberals won by a large amount, increasing their lead over the Conservatives. After the election, William Gladstone became the new Prime Minister.
This election was also special because it was the last time that only the two main parties won all the seats in Parliament. Back then, political parties were not as strictly organized as they are today.
Election Results
The results of the 1868 general election showed a clear victory for the Liberal Party. They won a majority of the seats in the House of Commons. This meant they had more Members of Parliament (MPs) than all other parties combined.
Here's a quick look at how the parties did:
| UK General Election 1868 | |||||||||||||||
|---|---|---|---|---|---|---|---|---|---|---|---|---|---|---|---|
| Party | Candidates | Votes | |||||||||||||
| Stood | Elected | Gained | Unseated | Net | % of total | % | No. | Net % | |||||||
| Liberal | 600 | 387 | +18 | 58.81 | 61.24 | 1,428,776 | +2.0 | ||||||||
| Conservative | 436 | 271 | −18 | 41.19 | 38.71 | 903,318 | −2.1 | ||||||||
| Others | 3 | 0 | 0 | 0 | 0 | 0 | 0.05 | 1,157 | N/A | ||||||
How People Voted
This section shows the percentage of votes each party received from the public. This is called the "popular vote."
| Popular vote | ||||
|---|---|---|---|---|
| Liberal | 61.24% | |||
| Conservative | 38.71% | |||
| Others | 0.05% | |||
Seats in Parliament
This section shows how many seats each party won in the House of Commons. The party with the most seats usually forms the government.
| Parliamentary seats | ||||
|---|---|---|---|---|
| Liberal | 58.81% | |||
| Conservative | 41.19% | |||
| Others | 0.0% | |||
 | Bayard Rustin |
 | Jeannette Carter |
 | Jeremiah A. Brown |


