1874 United Kingdom general election facts for kids
|
|||||||||||||||||||||||||||||||||||||||||||||
|
|
|||||||||||||||||||||||||||||||||||||||||||||
|
All 652 seats in the House of Commons 327 seats needed for a majority |
|||||||||||||||||||||||||||||||||||||||||||||
|---|---|---|---|---|---|---|---|---|---|---|---|---|---|---|---|---|---|---|---|---|---|---|---|---|---|---|---|---|---|---|---|---|---|---|---|---|---|---|---|---|---|---|---|---|---|
|
|||||||||||||||||||||||||||||||||||||||||||||

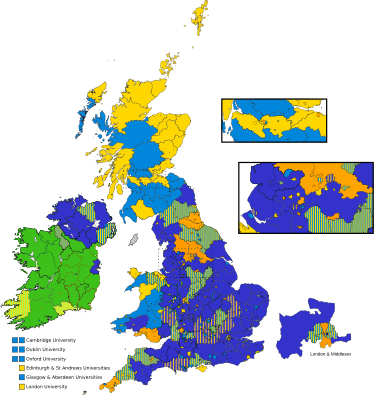
Colours denote the winning party
|
|||||||||||||||||||||||||||||||||||||||||||||
|
|||||||||||||||||||||||||||||||||||||||||||||
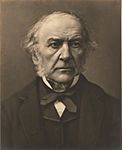
The 1874 United Kingdom general election was a big election where people across the UK voted for who would represent them in Parliament. The Liberals, led by William Gladstone, were in charge before the election. However, they lost badly, even though more people voted for them overall.
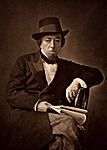
Benjamin Disraeli's Conservatives won the most seats in Parliament. This was mainly because they won many seats where no one else ran against them. It was the first time the Conservatives had won a general election since 1841. Gladstone's choice to call an election surprised his own team. They knew many people were unhappy with the Liberal government. For example, some religious groups were upset about education rules. Also, many working people disliked new laws about trade unions and rules about drinking.
The election was a disaster for the Liberals. They went from having 387 Members of Parliament (MPs) to only 242. The Conservatives, however, jumped from 271 to 350 MPs.
Contents
Key Outcomes of the 1874 Election
A New Political Landscape
The 1874 election brought some important changes to British politics. The Home Rule League, a new party from Ireland, became a significant third party. They won 60 out of 101 seats in Ireland. This showed a growing desire for Ireland to have more control over its own affairs.
The Secret Ballot
This election was the first to use a secret ballot. This meant people could vote without anyone knowing who they chose. Before this, landlords or employers might pressure people to vote a certain way. The secret ballot helped Irish tenants vote against their landlords' wishes without fear of being kicked out. This change likely helped the Home Rule League win so many seats.
Working-Class MPs
For the first time ever, two working-class MPs were elected. These were Alexander MacDonald and Thomas Burt. Both were members of the Miners' Union. They were elected as Liberal-Labour MPs. This meant they were working-class representatives who also supported the Liberal Party. MacDonald represented Stafford and Burt represented Morpeth. This was a big step for working people in politics.
Landowners Losing Power
The 1867 Reform Act had already reduced the power of wealthy landowners in law-making. The 1874 election continued this trend. Especially in Ireland, many big landowners lost their county seats to tenant farmers. This showed that political power was slowly shifting to a wider range of people.
A Unique Election Result
The 1874 election is special because it's the only time since the secret ballot was introduced that a party lost, even though it received more total votes. This happened because over 100 Conservative candidates were elected without anyone running against them. In these areas, no votes were cast. In places where Liberals did run, they often won by a large margin.
The election saw 652 MPs elected. This was six fewer than the previous election. Some areas, like Beverley, Sligo Borough, Bridgwater, and Cashel, had their constituencies (voting areas) removed due to past problems.
Election Results Overview
This section shows the overall results of the election.
| UK General Election 1874 | |||||||||||||||
|---|---|---|---|---|---|---|---|---|---|---|---|---|---|---|---|
| Party | Candidates | Votes | |||||||||||||
| Stood | Elected | Gained | Unseated | Net | % of total | % | No. | Net % | |||||||
| Liberal | 489 | 242 | −139 | 37.12 | 51.95 | 1,281,159 | −9.5 | ||||||||
| Conservative | 507 | 350 | +79 | 53.68 | 44.27 | 1,091,708 | +5.9 | ||||||||
| Home Rule | 80 | 60 | 0 | 0 | +60 | 9.20 | 3.66 | 90,234 | N/A | ||||||
| Others | 4 | 0 | 0 | 0 | 0 | 0 | 0.12 | 2,936 | 0.0 | ||||||
How People Voted
This chart shows the percentage of votes each main party received.
| Popular vote | ||||
|---|---|---|---|---|
| Liberal | 51.95% | |||
| Conservative | 44.27% | |||
| Home Rule | 3.66% | |||
| Others | 0.12% | |||
How Many Seats Each Party Won
This chart shows the percentage of seats each main party won in Parliament.
| Parliamentary seats | ||||
|---|---|---|---|---|
| Liberal | 37.12% | |||
| Conservative | 53.68% | |||
| Home Rule | 9.2% | |||
Images for kids
See also
- List of MPs elected in the 1874 United Kingdom general election
- 1874 United Kingdom general election in Ireland


