1982 Northern Ireland Assembly election facts for kids
|
|||||||||||||||||||||||||||||||||||||||||||||||||||||||||||||||||||||||||||||||||||||||||||||
|
|
|||||||||||||||||||||||||||||||||||||||||||||||||||||||||||||||||||||||||||||||||||||||||||||
|
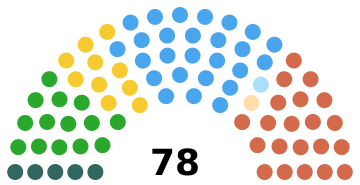
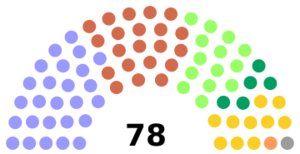
All 78 seats to the Northern Ireland Assembly 40 seats were needed for a majority |
|||||||||||||||||||||||||||||||||||||||||||||||||||||||||||||||||||||||||||||||||||||||||||||
|---|---|---|---|---|---|---|---|---|---|---|---|---|---|---|---|---|---|---|---|---|---|---|---|---|---|---|---|---|---|---|---|---|---|---|---|---|---|---|---|---|---|---|---|---|---|---|---|---|---|---|---|---|---|---|---|---|---|---|---|---|---|---|---|---|---|---|---|---|---|---|---|---|---|---|---|---|---|---|---|---|---|---|---|---|---|---|---|---|---|---|---|---|---|
|
|||||||||||||||||||||||||||||||||||||||||||||||||||||||||||||||||||||||||||||||||||||||||||||
 |
|||||||||||||||||||||||||||||||||||||||||||||||||||||||||||||||||||||||||||||||||||||||||||||
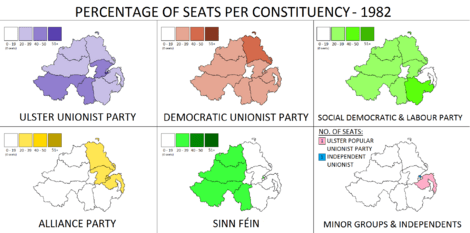
Percentage of seats gained by each of the party.
|
|||||||||||||||||||||||||||||||||||||||||||||||||||||||||||||||||||||||||||||||||||||||||||||
|
|||||||||||||||||||||||||||||||||||||||||||||||||||||||||||||||||||||||||||||||||||||||||||||
The 1982 Northern Ireland Assembly elections took place on October 20, 1982. These elections were an attempt to bring back "devolution" and "power-sharing" to Northern Ireland. Devolution means giving local people the power to make their own laws and decisions, instead of everything being decided by the main government. Power-sharing means different political groups work together in the government, even if they have different ideas.
The Northern Ireland Assembly was supposed to help with this. However, it didn't meet very often and didn't achieve much. It officially lasted until 1986.
Contents
Election Results and What Happened
The election results showed some interesting changes in Northern Ireland politics.
Key Party Outcomes
The results were a big success for Sinn Féin, a political party that had a new election plan. They won 5 seats in the Assembly. This was a new step for them in elections.
The SDLP was not happy with their results, winning 14 seats. One of their elected members, Seamus Mallon, later lost his seat because he was also a member of another parliament at the same time.
Among the Unionist parties, the UUP gained a clear lead over the DUP. Another party, the United Ulster Unionist Party, didn't do well and stopped existing a couple of years later.
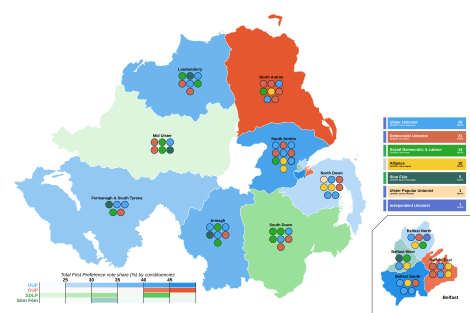
In the middle ground, the Alliance Party did well, winning 10 seats. They even won in areas like North and West Belfast, which was a surprise. The Workers' Party didn't win any seats, even though they got a good number of votes in some areas.
| Party | Votes | % | +/- | Seats | % | +/- | |||
|---|---|---|---|---|---|---|---|---|---|
| UUP | 188,277 | 29.7 | +3.9 | 26 | 33.8 | +7 | |||
| DUP | 145,528 | 23.0 | +8.2 | 21 | 27.3 | +9 | |||
| SDLP | 118,891 | 18.8 | -4.9 | 14 | 18.2 | -3 | |||
| Sinn Féin | 64,191 | 10.1 | N/A | 5 | 6.5 | +5 | |||
| Alliance | 58,851 | 9.3 | -0.5 | 10 | 13.0 | +2 | |||
| Workers' Party | 17,216 | 2.7 | +0.5 | 0 | N/A | 0 | |||
| UPUP | 14,916 | 2.3 | -1.2 | 1 | 1.3 | 0 | |||
| UUUP | 11,550 | 1.8 | 0 | N/A | 0 | ||||
| Ind U | 9,567 | 1.5 | N/A | 1 | 1.3 | +1 | |||
| Independent SDLP | 2,052 | 0.3 | -0.3 | 0 | N/A | 0 | |||
| Independent | 745 | 0.1 | N/A | 0 | N/A | 0 | |||
| Ecology | 707 | 0.1 | N/A | 0 | N/A | 0 | |||
| Newtownabbey Labour | 560 | 0.1 | N/A | 0 | N/A | 0 | |||
| People's Democracy | 442 | 0.1 | N/A | 0 | N/A | 0 | |||
| Communist Party | 415 | 0.1 | N/A | 0 | N/A | 0 | |||
| Ulster Liberal | 65 | 0.0 | N/A | 0 | N/A | 0 | |||
| Peace | 19 | 0.0 | N/A | 0 | N/A | 0 | |||
| Total | 633,120 | 100 | 0 | 78 | 100 | 0 | |||
| Source: Ark | |||||||||
Summary of Votes
This chart shows the percentage of votes each main party received in the election.
| Popular vote | ||||
|---|---|---|---|---|
| Ulster Unionist | 29.7% | |||
| DUP | 23.0% | |||
| SDLP | 18.8% | |||
| Sinn Féin | 10.1% | |||
| Alliance | 9.3% | |||
| Workers' Party (Ireland) | 2.7% | |||
| Ulster Popular Unionist | 2.2% | |||
| UUUP | 1.8% | |||
| Ind. Unionist | 0.9% | |||
| Other | 0.7% | |||
Summary of Seats Won
This chart shows how many seats each party won in the Assembly.
| Parliamentary seats | ||||
|---|---|---|---|---|
| Ulster Unionist | 33.8% | |||
| DUP | 27.3% | |||
| SDLP | 18.2% | |||
| Alliance | 13.0% | |||
| Sinn Féin | 6.5% | |||
| Ulster Popular Unionist | 1.3% | |||
| Ind. Unionist | 1.3% | |||
See also
 | Frances Mary Albrier |
 | Whitney Young |
 | Muhammad Ali |


