Ainaro facts for kids
Quick facts for kids
Ainaro
|
|
|---|---|
|
Town
|
|
 |
|
| Country | |
| Municipality | Ainaro |
| Administrative post | Ainaro |
| Elevation | 831 m (2,726 ft) |
| Time zone | TLT |
| Climate | Am |
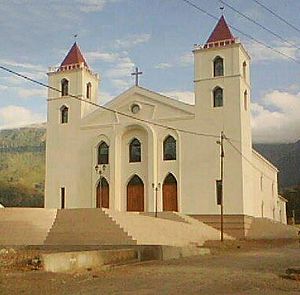
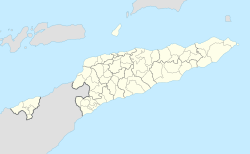
Ainaro is a town in East Timor, a country in Southeast Asia. It's an important place because it's the capital of the Ainaro area. This includes the Ainaro suco, administrative post, and municipality. You can find Ainaro in the southwest part of East Timor. It is about 78 kilometers (48 miles) south of Dili, which is the capital city of the whole country.
Ainaro's History
Between 1975 and 1999, Ainaro faced a difficult time. During this period, many buildings in the town were destroyed. More than 95% of its buildings were ruined. This happened in 1999, just before East Timor voted to become an independent country.
Ainaro's Climate
Ainaro has a special climate that is a mix of two types: a tropical savanna climate and a tropical monsoon climate. This means it gets a lot of rain.
Compared to Dili, the capital city, Ainaro receives about two and a half times more rain each year. This is because Ainaro is on the side of the island that faces the strong southeastern winds. These winds bring a lot of moisture, especially during the time when Dili might be having its dry season.
| Climate data for Ainaro, East Timor (1928-1941) | |||||||||||||
|---|---|---|---|---|---|---|---|---|---|---|---|---|---|
| Month | Jan | Feb | Mar | Apr | May | Jun | Jul | Aug | Sep | Oct | Nov | Dec | Year |
| Record high °C (°F) | 31.1 (88.0) |
31.1 (88.0) |
33.3 (91.9) |
30.0 (86.0) |
33.3 (91.9) |
29.0 (84.2) |
30.0 (86.0) |
30.0 (86.0) |
30.0 (86.0) |
32.2 (90.0) |
33.3 (91.9) |
32.2 (90.0) |
33.3 (91.9) |
| Mean daily maximum °C (°F) | 27.0 (80.6) |
26.7 (80.1) |
26.5 (79.7) |
25.7 (78.3) |
25.6 (78.1) |
24.3 (75.7) |
23.9 (75.0) |
25.1 (77.2) |
26.5 (79.7) |
26.9 (80.4) |
27.8 (82.0) |
27.9 (82.2) |
26.1 (79.0) |
| Daily mean °C (°F) | 22.7 (72.9) |
22.5 (72.5) |
22.6 (72.7) |
21.7 (71.1) |
21.5 (70.7) |
20.5 (68.9) |
19.7 (67.5) |
20.1 (68.2) |
21.4 (70.5) |
21.9 (71.4) |
22.6 (72.7) |
22.9 (73.2) |
21.7 (71.0) |
| Mean daily minimum °C (°F) | 18.4 (65.1) |
18.4 (65.1) |
18.7 (65.7) |
17.7 (63.9) |
17.4 (63.3) |
16.8 (62.2) |
15.4 (59.7) |
15.1 (59.2) |
16.4 (61.5) |
17.0 (62.6) |
17.5 (63.5) |
17.8 (64.0) |
17.2 (63.0) |
| Record low °C (°F) | 14.4 (57.9) |
13.3 (55.9) |
15.5 (59.9) |
13.3 (55.9) |
10.0 (50.0) |
10.0 (50.0) |
10.0 (50.0) |
9.9 (49.8) |
10.0 (50.0) |
10.0 (50.0) |
10.0 (50.0) |
12.2 (54.0) |
9.9 (49.8) |
| Average rainfall mm (inches) | 341.5 (13.44) |
337.6 (13.29) |
338.7 (13.33) |
202.1 (7.96) |
166.7 (6.56) |
92.6 (3.65) |
47.6 (1.87) |
6.3 (0.25) |
26.8 (1.06) |
94.8 (3.73) |
217.8 (8.57) |
454.5 (17.89) |
2,326.8 (91.61) |
| Average rainy days | 17.9 | 16.3 | 18.7 | 12.6 | 11.5 | 9.8 | 7.9 | 2.3 | 1.5 | 4.0 | 9.8 | 17.7 | 129.8 |
| Source: NOAA | |||||||||||||
Sister Cities
Ainaro has special friendships with two cities in other countries:
 | Delilah Pierce |
 | Gordon Parks |
 | Augusta Savage |
 | Charles Ethan Porter |


