Bajo Calima facts for kids
Quick facts for kids
Bajo Calima
|
|
|---|---|
| Country | |
| Department | Valle del Cauca |
| Municipality | Buenaventura municipality |
| Elevation | 160 ft (50 m) |
| Population
(2018)
|
|
| • Total | 1,162 |
| Time zone | UTC-5 (Colombia Standard Time) |
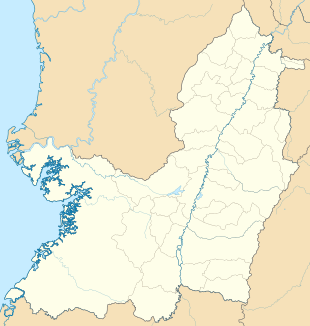
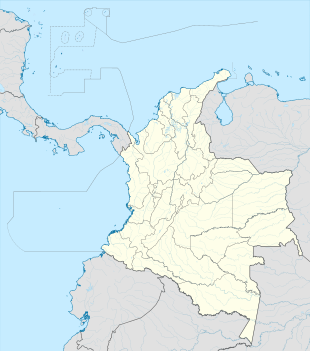
Bajo Calima is a small village located in the Buenaventura Municipality. It is part of the Valle del Cauca Department in Colombia. In 2018, about 1,162 people lived there.
Contents
What is the Climate Like in Bajo Calima?
Bajo Calima has a very wet and warm climate. It is known as a tropical rainforest climate. This means it gets a lot of rain all year round. The weather is usually hot and humid.
How Hot Does it Get?
The average temperature in Bajo Calima is around 25 to 26 degrees Celsius (about 77 to 79 degrees Fahrenheit). The highest temperatures are usually around 30 degrees Celsius (86 degrees Fahrenheit). The lowest temperatures are around 22 to 23 degrees Celsius (72 to 73 degrees Fahrenheit).
How Much Rain Does it Get?
Bajo Calima is one of the wettest places. It receives a huge amount of rain every year. On average, it rains for about 25 to 29 days each month! The total rainfall for a year can be over 7,000 millimeters (about 275 inches). This is why it's called a rainforest climate.
| Climate data for Bajo Calima, Buenaventura, elevation 50 m (160 ft), (1981–2010) | |||||||||||||
|---|---|---|---|---|---|---|---|---|---|---|---|---|---|
| Month | Jan | Feb | Mar | Apr | May | Jun | Jul | Aug | Sep | Oct | Nov | Dec | Year |
| Mean daily maximum °C (°F) | 29.8 (85.6) |
30.4 (86.7) |
30.5 (86.9) |
30.6 (87.1) |
30.4 (86.7) |
30.1 (86.2) |
30.0 (86.0) |
30.0 (86.0) |
29.8 (85.6) |
29.6 (85.3) |
29.5 (85.1) |
29.6 (85.3) |
30 (86) |
| Daily mean °C (°F) | 25.7 (78.3) |
26.0 (78.8) |
26.1 (79.0) |
26.1 (79.0) |
26.1 (79.0) |
25.8 (78.4) |
25.8 (78.4) |
25.7 (78.3) |
25.5 (77.9) |
25.4 (77.7) |
25.5 (77.9) |
25.6 (78.1) |
25.8 (78.4) |
| Mean daily minimum °C (°F) | 22.5 (72.5) |
22.7 (72.9) |
22.7 (72.9) |
22.8 (73.0) |
22.7 (72.9) |
22.6 (72.7) |
22.4 (72.3) |
22.5 (72.5) |
22.4 (72.3) |
22.3 (72.1) |
22.5 (72.5) |
22.5 (72.5) |
22.5 (72.5) |
| Average precipitation mm (inches) | 437.4 (17.22) |
341.3 (13.44) |
453.4 (17.85) |
616.9 (24.29) |
727.1 (28.63) |
560.3 (22.06) |
659.4 (25.96) |
705.7 (27.78) |
782.5 (30.81) |
791.2 (31.15) |
729.8 (28.73) |
634.6 (24.98) |
7,439.6 (292.90) |
| Average precipitation days | 24 | 21 | 22 | 25 | 28 | 27 | 28 | 28 | 28 | 29 | 25 | 26 | 307 |
| Average relative humidity (%) | 88 | 88 | 88 | 89 | 89 | 90 | 89 | 89 | 89 | 90 | 90 | 89 | 89 |
| Mean monthly sunshine hours | 89.9 | 79.0 | 77.5 | 81.0 | 80.6 | 75.0 | 86.8 | 83.7 | 69.0 | 71.3 | 75.0 | 83.7 | 952.5 |
| Mean daily sunshine hours | 2.9 | 2.8 | 2.5 | 2.7 | 2.6 | 2.5 | 2.8 | 2.7 | 2.3 | 2.3 | 2.5 | 2.7 | 2.6 |
| Source: Instituto de Hidrologia Meteorologia y Estudios Ambientales | |||||||||||||
| Climate data for Cabeceras Rio San Juan (Mision La), elevation 5 m (16 ft), (1981–2010) | |||||||||||||
|---|---|---|---|---|---|---|---|---|---|---|---|---|---|
| Month | Jan | Feb | Mar | Apr | May | Jun | Jul | Aug | Sep | Oct | Nov | Dec | Year |
| Mean daily maximum °C (°F) | 29.3 (84.7) |
29.9 (85.8) |
30.3 (86.5) |
30.1 (86.2) |
29.8 (85.6) |
29.5 (85.1) |
29.6 (85.3) |
29.5 (85.1) |
29.2 (84.6) |
28.8 (83.8) |
28.4 (83.1) |
28.6 (83.5) |
29.4 (84.9) |
| Daily mean °C (°F) | 25.6 (78.1) |
26.0 (78.8) |
26.1 (79.0) |
26.1 (79.0) |
26.1 (79.0) |
25.8 (78.4) |
25.8 (78.4) |
25.7 (78.3) |
25.5 (77.9) |
25.3 (77.5) |
25.2 (77.4) |
25.3 (77.5) |
25.7 (78.3) |
| Mean daily minimum °C (°F) | 23.1 (73.6) |
23.2 (73.8) |
23.4 (74.1) |
23.4 (74.1) |
23.5 (74.3) |
23.2 (73.8) |
22.9 (73.2) |
23.0 (73.4) |
22.9 (73.2) |
22.8 (73.0) |
22.9 (73.2) |
23.0 (73.4) |
23.1 (73.6) |
| Average precipitation mm (inches) | 418.1 (16.46) |
272.5 (10.73) |
337.3 (13.28) |
458.0 (18.03) |
642.6 (25.30) |
612.6 (24.12) |
690.0 (27.17) |
760.8 (29.95) |
819.6 (32.27) |
790.0 (31.10) |
728.5 (28.68) |
675.8 (26.61) |
7,205.9 (283.70) |
| Average precipitation days | 24 | 18 | 20 | 23 | 25 | 24 | 27 | 26 | 26 | 25 | 26 | 26 | 288 |
| Average relative humidity (%) | 91 | 89 | 90 | 90 | 91 | 92 | 91 | 91 | 91 | 92 | 92 | 92 | 91 |
| Mean monthly sunshine hours | 77.5 | 79.0 | 83.7 | 84.0 | 80.6 | 75.0 | 83.7 | 86.8 | 66.0 | 71.3 | 63.0 | 68.2 | 918.8 |
| Mean daily sunshine hours | 2.5 | 2.8 | 2.7 | 2.8 | 2.6 | 2.5 | 2.7 | 2.8 | 2.2 | 2.3 | 2.1 | 2.2 | 2.5 |
| Source: Instituto de Hidrologia Meteorologia y Estudios Ambientales | |||||||||||||
See also
 In Spanish: Bajo Calima para niños


