Black Creek, North Carolina facts for kids
Quick facts for kids
Black Creek, North Carolina
|
|
|---|---|

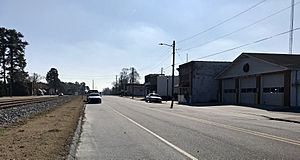
West Center Street in 2021
|
|
| Motto(s):
"A Small Town With A Big Heart"
|
|
| Country | United States |
| State | North Carolina |
| County | Wilson |
| Area | |
| • Total | 0.71 sq mi (1.84 km2) |
| • Land | 0.71 sq mi (1.83 km2) |
| • Water | 0.00 sq mi (0.00 km2) |
| Elevation | 125 ft (38 m) |
| Population
(2020)
|
|
| • Total | 692 |
| • Density | 977.40/sq mi (377.38/km2) |
| Time zone | UTC-5 (Eastern (EST)) |
| • Summer (DST) | UTC-4 (EDT) |
| ZIP code |
27813
|
| Area code(s) | 252 |
| FIPS code | 37-06080 |
| GNIS feature ID | 2405271 |
| Website | http://www.townofblackcreek.org/ |
Black Creek is a small town located in Wilson County, North Carolina, in the United States. It's known for its friendly community and has the motto "A Small Town With a Big Heart." In 2020, about 692 people lived there.
Contents
History of Black Creek
Black Creek has some interesting old buildings that are important to its past. Three places, the Manalcus Aycock House, the Black Creek Rural Historic District, and the Dr. H. D. Lucas House, were added to the National Register of Historic Places in 1986. This list helps protect special buildings and areas across the country because they are important for history or architecture.
Geography of Black Creek
Black Creek is a small town when it comes to its size. According to the United States Census Bureau, the town covers about 0.7 square miles (1.8 square kilometers) of land. There isn't any water area within the town limits.
People and Population in Black Creek
Understanding demographics helps us learn about the people who live in a town. This includes things like how many people live there, their ages, and how households are set up.
Population Changes Over Time
The number of people living in Black Creek has changed over many years. Here's how the population has grown and shrunk since 1870:
| Historical population | |||
|---|---|---|---|
| Census | Pop. | %± | |
| 1870 | 77 | — | |
| 1880 | 129 | 67.5% | |
| 1890 | 191 | 48.1% | |
| 1900 | 196 | 2.6% | |
| 1910 | 219 | 11.7% | |
| 1920 | 274 | 25.1% | |
| 1930 | 355 | 29.6% | |
| 1940 | 333 | −6.2% | |
| 1950 | 316 | −5.1% | |
| 1960 | 310 | −1.9% | |
| 1970 | 449 | 44.8% | |
| 1980 | 523 | 16.5% | |
| 1990 | 615 | 17.6% | |
| 2000 | 714 | 16.1% | |
| 2010 | 769 | 7.7% | |
| 2020 | 692 | −10.0% | |
| U.S. Decennial Census | |||
Life in Black Creek (2000 Census)
In 2000, there were 714 people living in Black Creek. These people lived in 279 different homes, and 210 of those were families. The town had about 1,062 people per square mile (409 people per square kilometer).
Most people in Black Creek were White (about 77.7%). About 18.9% were African American. A small number of people were Asian or from other backgrounds. About 2.2% of the population identified as Hispanic or Latino.
Many homes (38%) had children under 18 living there. More than half of the homes (53%) were married couples. About 21.5% of homes had just one person living there.
The average age of people in Black Creek was 34 years old. About 26.9% of the population was under 18, and 9.1% were 65 or older.
Income and Economy
In 2000, the average income for a household in Black Creek was about $30,368 per year. For families, the average income was a bit higher, around $32,857.
The "per capita income" means the average income for every person in the town. In Black Creek, this was about $13,661. About 16.9% of all the people in Black Creek lived below the poverty line. This means their income was below a certain level set by the government.
See also
 In Spanish: Black Creek (Carolina del Norte) para niños


