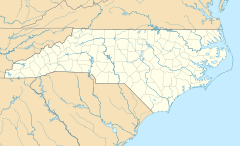
Boardman, North Carolina facts for kids
Quick facts for kids
Boardman, North Carolina
|
|
|---|---|
| Country | United States |
| State | North Carolina |
| County | Columbus |
| Government | |
| • Type | Town Council |
| Area | |
| • Total | 3.11 sq mi (8.06 km2) |
| • Land | 3.09 sq mi (8.00 km2) |
| • Water | 0.02 sq mi (0.06 km2) |
| Elevation | 89 ft (27 m) |
| Population
(2020)
|
|
| • Total | 166 |
| • Density | 53.76/sq mi (20.75/km2) |
| Time zone | UTC-5 (Eastern (EST)) |
| • Summer (DST) | UTC-4 (EDT) |
| FIPS code | 37-06660 |
| GNIS feature ID | 2405292 |
Boardman is a small town located in Columbus County, North Carolina, in the United States. It is a quiet community with a population of 166 people, according to the 2020 census. The town is governed by a Town Council, and its current mayor is Randy Williamson.
Contents
Where is Boardman Located?
Boardman is situated in North Carolina. The town covers a total area of about 3.1 square miles (which is about 8.1 square kilometers). Most of this area is land, with only a very small part being water.
Who Lives in Boardman?
The number of people living in Boardman has changed over the years. In 2020, 166 people lived in the town. Let's look at how the population has changed and who makes up the community.
Boardman's Population Over Time
Here's a quick look at how many people have lived in Boardman during different census years:
- 1900: 604 people
- 1910: 796 people
- 1920: 828 people
- 1930: 158 people
- 2000: 202 people
- 2010: 157 people
- 2020: 166 people
A Look at Boardman's Community in 2020
The 2020 census helps us understand the different groups of people living in Boardman. Here is a breakdown of the community:
| Group | Number in 2010 | Number in 2020 | Percentage in 2010 | Percentage in 2020 |
|---|---|---|---|---|
| White (not Hispanic or Latino) | 104 | 93 | 66.24% | 56.02% |
| Black or African American (not Hispanic or Latino) | 53 | 45 | 33.76% | 27.11% |
| Native American or Alaska Native (not Hispanic or Latino) | 0 | 5 | 0.00% | 3.01% |
| Asian (not Hispanic or Latino) | 0 | 0 | 0.00% | 0.00% |
| Pacific Islander (not Hispanic or Latino) | 0 | 0 | 0.00% | 0.00% |
| Some Other Race (not Hispanic or Latino) | 0 | 1 | 0.00% | 0.60% |
| Mixed Race/Multi-Racial (not Hispanic or Latino) | 0 | 4 | 0.00% | 2.41% |
| Hispanic or Latino (any race) | 0 | 18 | 0.00% | 10.84% |
| Total Population | 157 | 166 | 100.00% | 100.00% |
Please note: The US Census counts people of Hispanic or Latino background as a separate group, regardless of their race. This table shows them separately from the racial categories.
See also
 In Spanish: Boardman (Carolina del Norte) para niños
 | Kyle Baker |
 | Joseph Yoakum |
 | Laura Wheeler Waring |
 | Henry Ossawa Tanner |


