Bremen, Kentucky facts for kids
Quick facts for kids
Bremen, Kentucky
|
|
|---|---|

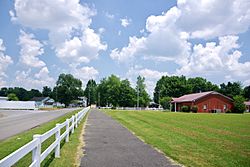
Walking trail and community center in Bremen
|
|

Location of Bremen in Muhlenberg County, Kentucky.
|
|
| Country | United States |
| State | Kentucky |
| County | Muhlenberg |
| Area | |
| • Total | 0.21 sq mi (0.54 km2) |
| • Land | 0.21 sq mi (0.54 km2) |
| • Water | 0.00 sq mi (0.00 km2) |
| Elevation | 459 ft (140 m) |
| Population
(2020)
|
|
| • Total | 172 |
| • Density | 830.92/sq mi (321.04/km2) |
| Time zone | UTC-6 (Central (CST)) |
| • Summer (DST) | UTC-5 (CDT) |
| ZIP code |
42325
|
| Area code(s) | 270 |
| FIPS code | 21-09406 |
| GNIS feature ID | 0487858 |
Bremen is a small city located in Muhlenberg County, Kentucky, in the United States. It is known as a home rule-class city, which means it has the power to manage its own local affairs. In 2020, about 172 people lived there.
Contents
Exploring Bremen's Past
Bremen was first settled by immigrants from Germany. They named the city after their home city of Bremen, Germany. A post office has been open in Bremen since 1832, helping people send and receive mail for a very long time.
The 2021 Tornado Event
On December 10, 2021, a very powerful tornado hit Bremen. It caused a lot of damage, especially in the northern part of the city. Many buildings were destroyed or badly damaged. Sadly, this event also led to the loss of lives. The community has been working hard to rebuild and recover since then.
Where is Bremen Located?
Bremen is found at specific map coordinates: 37.363240 degrees North and 87.217510 degrees West. It is located along Kentucky Route 81. This road is northwest of a larger town called Central City.
Size of the City
According to the United States Census Bureau, Bremen covers an area of about 0.6 square miles (or 0.54 square kilometers). All of this area is land, meaning there are no large bodies of water like lakes or rivers within the city limits.
How Many People Live in Bremen?
The number of people living in Bremen has changed over the years. Here is a quick look at the population counts from different census years:
| Historical population | |||
|---|---|---|---|
| Census | Pop. | %± | |
| 1880 | 98 | — | |
| 1900 | 180 | — | |
| 1910 | 254 | 41.1% | |
| 1920 | 172 | −32.3% | |
| 1930 | 255 | 48.3% | |
| 1940 | 239 | −6.3% | |
| 1950 | 410 | 71.5% | |
| 1960 | 328 | −20.0% | |
| 1970 | 299 | −8.8% | |
| 1980 | 179 | −40.1% | |
| 1990 | 267 | 49.2% | |
| 2000 | 365 | 36.7% | |
| 2010 | 197 | −46.0% | |
| 2020 | 172 | −12.7% | |
| U.S. Decennial Census | |||
See also
 In Spanish: Bremen (Kentucky) para niños
 | Delilah Pierce |
 | Gordon Parks |
 | Augusta Savage |
 | Charles Ethan Porter |

