Chiquián facts for kids
Quick facts for kids
Chiquián
Chiqllan
|
|
|---|---|
|
Town
|
|

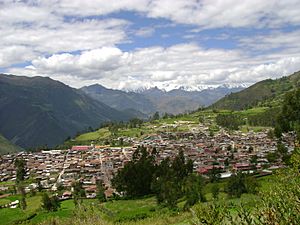
The town Chiquián with the Huayhuash mountain range in the background
|
|
| Country | |
| Region | Ancash |
| Province | Bolognesi |
| District | Chiquián |
| Population
(2019)
|
|
| • Total | 3,641 |
Chiquián (also known as Chiqllan in the Quechua language) is a town located in the middle of Peru. It's like the main city, or capital, of the Bolognesi Province in the Ancash Region. People often call it "the mirror of the sky" (which is el espejito del cielo in Spanish) because of its beautiful views.
Contents
Chiquián's Location and Government
Chiquián is an important town in the Ancash Region of Peru. It serves as the capital of the Bolognesi Province. This means it's the main center for the smaller towns and areas around it.
Who Leads Chiquián?
The town of Chiquián is led by a person called the Mayor. The Mayor helps make decisions for the town and its people. As of 2019, the Mayor of Chiquián is Gudberto Carrera Padilla.
Chiquián's Climate and Weather
The climate in Chiquián is quite interesting because of its high elevation. The town is located at about 3,414 meters (which is about 11,198 feet) above sea level. This high location affects its weather throughout the year.
Temperature in Chiquián
Chiquián generally has mild temperatures. The highest temperatures usually stay around 20 to 21 degrees Celsius (about 68 to 70 degrees Fahrenheit) all year round. The lowest temperatures are cooler, ranging from about 3 to 4.5 degrees Celsius (about 37 to 40 degrees Fahrenheit).
Rainfall in Chiquián
The amount of rain Chiquián gets changes a lot during the year.
- The rainiest months are usually from January to March. During these months, the town can get over 100 millimeters (about 4 inches) of rain.
- From May to August, it's much drier. Sometimes, there's hardly any rain at all, with less than 2 millimeters (0.08 inches) in July and June.
- The rain starts to pick up again in September and November.
| Climate data for Chiquián, elevation 3,414 m (11,201 ft), (1991–2020) | |||||||||||||
|---|---|---|---|---|---|---|---|---|---|---|---|---|---|
| Month | Jan | Feb | Mar | Apr | May | Jun | Jul | Aug | Sep | Oct | Nov | Dec | Year |
| Mean daily maximum °C (°F) | 21.2 (70.2) |
20.8 (69.4) |
20.8 (69.4) |
21.0 (69.8) |
21.0 (69.8) |
20.6 (69.1) |
20.8 (69.4) |
21.3 (70.3) |
21.7 (71.1) |
21.4 (70.5) |
21.4 (70.5) |
21.2 (70.2) |
21.1 (70.0) |
| Mean daily minimum °C (°F) | 4.3 (39.7) |
4.5 (40.1) |
4.5 (40.1) |
4.5 (40.1) |
3.9 (39.0) |
3.3 (37.9) |
3.1 (37.6) |
3.5 (38.3) |
4.0 (39.2) |
4.1 (39.4) |
4.1 (39.4) |
4.3 (39.7) |
4.0 (39.2) |
| Average precipitation mm (inches) | 106.1 (4.18) |
127.8 (5.03) |
145.9 (5.74) |
66.0 (2.60) |
13.7 (0.54) |
0.9 (0.04) |
0.2 (0.01) |
1.9 (0.07) |
11.8 (0.46) |
34.2 (1.35) |
42.5 (1.67) |
92.6 (3.65) |
643.6 (25.34) |
| Source: National Meteorology and Hydrology Service of Peru | |||||||||||||
See also
 In Spanish: Chiquián para niños
 | Audre Lorde |
 | John Berry Meachum |
 | Ferdinand Lee Barnett |

