Clark, Pennsylvania facts for kids
Quick facts for kids
Clark, Pennsylvania
|
|
|---|---|
|
Borough
|
|
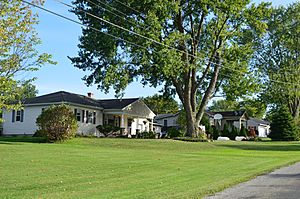
Houses on Milton Street
|
|
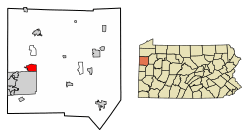
Location of Clark in Mercer County, Pennsylvania.
|
|
| Country | United States |
| State | Pennsylvania |
| County | Mercer |
| Established | 1829 |
| Area | |
| • Total | 3.62 sq mi (9.38 km2) |
| • Land | 3.01 sq mi (7.80 km2) |
| • Water | 0.61 sq mi (1.58 km2) |
| Highest elevation
(southwest corner of township)
|
1,200 ft (400 m) |
| Lowest elevation
(Shenango River Reservoir)
|
896 ft (273 m) |
| Population
(2020)
|
|
| • Total | 576 |
| • Density | 191.30/sq mi (73.87/km2) |
| Time zone | UTC-4 (EST) |
| • Summer (DST) | UTC-5 (EDT) |
| Zip code |
16113
|
| Area code(s) | 724 |
Clark is a small town called a borough. It is located in western Mercer County, Pennsylvania, in the United States. You can find it along the southern shore of the Shenango River Reservoir. In 2020, about 576 people lived there. Clark is part of the larger Hermitage area.
Contents
History of Clark
Clark was once known as Clarksville. This name was used until the late 1950s. The original town was moved to its current spot. This happened because a dam was built on the Shenango River. The dam was constructed near Sharpsville to help control floods.
Geography and Location
Clark is located at specific coordinates: 41.282049 degrees North and 80.409591 degrees West. These numbers help pinpoint its exact spot on a map.
Land and Water Area
The borough covers a total area of about 3.8 square miles (9.38 square kilometers). Most of this area is land, about 3.0 square miles (7.80 square kilometers). The rest, about 0.7 square miles (1.58 square kilometers), is water. This means about 19% of Clark's total area is water.
Places to See in Clark
- NorthStar Marina
- Pete's Berry Farm
- Clark House
Population Information
Clark's population has changed over the years. Here is a quick look at how many people have lived there:
| Historical population | |||
|---|---|---|---|
| Census | Pop. | %± | |
| 1880 | 264 | — | |
| 1900 | 220 | — | |
| 1910 | 216 | −1.8% | |
| 1920 | 224 | 3.7% | |
| 1930 | 279 | 24.6% | |
| 1940 | 321 | 15.1% | |
| 1950 | 345 | 7.5% | |
| 1960 | 312 | −9.6% | |
| 1970 | 467 | 49.7% | |
| 1980 | 667 | 42.8% | |
| 1990 | 610 | −8.5% | |
| 2000 | 633 | 3.8% | |
| 2010 | 640 | 1.1% | |
| 2020 | 576 | −10.0% | |
| 2021 (est.) | 571 | −10.8% | |
| Sources: | |||
In 2000, there were 633 people living in Clark. There were 227 households, which are groups of people living together. Most of these households (194) were families. The average household had about 2.79 people. The average family had about 3.02 people.
The population included people of different ages. About 23.4% were under 18 years old. About 13.1% were 65 years or older. The average age in Clark was 41 years.
See also
 In Spanish: Clark (Pensilvania) para niños
 | Janet Taylor Pickett |
 | Synthia Saint James |
 | Howardena Pindell |
 | Faith Ringgold |

