
Climate of Anchorage facts for kids
Anchorage, Alaska, often called Dgheyay Kaq' or Dgheyaytnu in the native Dena'ina language, has a special kind of climate called a subarctic climate. This means its summers are short and cool, and its winters are long and cold. The weather can be quite surprising from day to day! Some winters bring lots of snow and very cold temperatures, while summers are usually mild.
Because Anchorage is so far north, summer days are super long, with the sun staying out for over 18 hours! But in winter, the days are very short, with only about 5 and a half hours of daylight. It's also often cloudy in winter, which makes it feel even darker.
Contents
Temperature
How Warm and Cold It Gets

In summer, the average daytime temperatures in Anchorage are usually between 55 and 78 degrees Fahrenheit (12.8 to 25.6 degrees Celsius). In winter, the average daytime temperatures drop to about 5 to 30 degrees Fahrenheit (-15.0 to -1.1 degrees Celsius).
Anchorage has about 100 days each year when it's warm enough for plants to grow without frost. At the main airport, Ted Stevens Anchorage International Airport, the average low in January is 11°F (-11.7°C) and the average high is 23°F (-5.0°C). They also get a lot of snow, about 75.59 inches (1.92 meters) each winter!
In July, the warmest month, the average low is 52°F (11.1°C) and the average high is 66°F (18.9°C). The hottest temperature ever recorded in Anchorage was 90°F (32.2°C) on July 4, 2019.
Precipitation
How Much Rain Falls
From 2000 to 2022, Anchorage received about 16.7 inches of rain each year. The rainiest months are usually August and September. In August, they get about 2.75 inches of rain, and in September, about 3.24 inches.
How Much Snow Falls

For snow, the average amount each year from 2000 to 2022 was 76.4 inches. The winter of 2011-2012 had the most snow, with a huge 134.5 inches! The winter of 2015 had the least, with only 25.1 inches.
Climate Change
The climate in Anchorage is changing, just like in many other places around the world. Since 1940, the average yearly temperature in Anchorage has gone up by 3 degrees Celsius (about 5.4 degrees Fahrenheit).
Because of these changes, the leaders of Anchorage created a plan in 2019 to help the city prepare for and deal with the effects of climate change. One big goal of this plan is to reduce the amount of greenhouse gases (gases that trap heat in the atmosphere) by 80% by the year 2050, compared to 2008 levels. They also made a shorter, easier-to-understand version of their plan to help everyone learn about what they are doing.
| Weather chart for Anchorage | |||||||||||||||||||||||||||||||||||||||||||||||
|---|---|---|---|---|---|---|---|---|---|---|---|---|---|---|---|---|---|---|---|---|---|---|---|---|---|---|---|---|---|---|---|---|---|---|---|---|---|---|---|---|---|---|---|---|---|---|---|
| J | F | M | A | M | J | J | A | S | O | N | D | ||||||||||||||||||||||||||||||||||||
|
0.7
23
11
|
0.7
27
14
|
0.6
34
19
|
0.5
45
29
|
0.8
56
39
|
1
63
47
|
1.8
66
52
|
3.2
64
49
|
3
55
41
|
2
40
29
|
1.2
27
17
|
1.1
24
13
|
||||||||||||||||||||||||||||||||||||
| temperatures in °F precipitation totals in inches |
|||||||||||||||||||||||||||||||||||||||||||||||
|
Metric conversion
|
|||||||||||||||||||||||||||||||||||||||||||||||
Notable Climate Events
Anchorage is near active volcanoes, so sometimes volcanic ash can fall on the city. This doesn't happen often, but it can be a big deal when it does. In August 1992, Mount Spurr, a volcano about 78 miles (126 km) west of Anchorage, erupted. About 0.12 inches (3 mm) of ash covered the city. Cleaning up all that ash was a huge job and caused problems for the city's water system.
On March 17, 2002, a massive snowstorm hit Anchorage, dropping 28.6 inches of snow! This was so much snow that schools had to close for two days. It broke the old record for the most snowfall in a single day, which was 15.6 inches back in 1955.
Images for kids
-
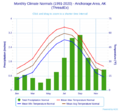
Climate chart for Anchorage
_-_Anchorage_Area,_AK(ThreadEx).svg)
