Corunna, Indiana facts for kids
Quick facts for kids
Corunna, Indiana
|
|
|---|---|

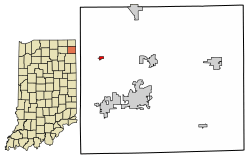
Location of Corunna in DeKalb County, Indiana.
|
|
| Country | United States |
| State | Indiana |
| County | DeKalb |
| Township | Richland |
| Area | |
| • Total | 0.18 sq mi (0.46 km2) |
| • Land | 0.18 sq mi (0.46 km2) |
| • Water | 0.00 sq mi (0.00 km2) |
| Elevation | 968 ft (295 m) |
| Population
(2020)
|
|
| • Total | 236 |
| • Density | 1,318.44/sq mi (509.97/km2) |
| Time zone | UTC-5 (EST) |
| • Summer (DST) | UTC-4 (DST) |
| ZIP code |
46730
|
| Area code(s) | 260 |
| FIPS code | 18-15220 |
| GNIS feature ID | 2396663 |
Corunna is a small town located in Richland Township, DeKalb County, Indiana, in the United States. In 2020, about 236 people lived there.
Contents
History of Corunna
Corunna got its first post office in 1858. It is thought that the town was named after Corunna, Michigan.
Many years ago, in 1914, Corunna was a busy place. It had three schools, a bank, two mills (places that process grain), and even a hotel.
Corunna's Location and Size
Corunna is a small town. Based on the 2010 census, its total area is about 0.17 square miles (0.44 square kilometers). All of this area is land.
Who Lives in Corunna?
Population Changes Over Time
The number of people living in Corunna has changed over the years. Here is how the population has grown and shrunk:
- 1870: 242 people
- 1880: 276 people
- 1910: 318 people
- 1920: 272 people
- 1930: 268 people
- 1940: 278 people
- 1950: 338 people
- 1960: 361 people
- 1970: 359 people
- 1980: 304 people
- 1990: 241 people
- 2000: 254 people
- 2010: 254 people
- 2020: 236 people
Corunna in 2010
In 2010, there were 254 people living in Corunna. These people lived in 88 different homes. About 64 of these homes were families.
The town had 98 housing units in total. Most of the people living in Corunna (about 94.9%) were White. A small number of people were from other racial backgrounds. About 4.3% of the population identified as Hispanic or Latino.
Families and Age Groups
In 2010, about 42% of the homes had children under 18 living there. Nearly half (48.9%) were married couples. Some homes had a single parent, either a mother (12.5%) or a father (11.4%).
The average age of people in Corunna was 34.3 years old.
- About 29.5% of residents were under 18.
- About 6.6% were between 18 and 24 years old.
- About 28.4% were between 25 and 44 years old.
- About 25.1% were between 45 and 64 years old.
- About 10.2% were 65 years or older.
The town had a nearly even number of males and females. About 49.2% of the population was male, and 50.8% was female.
See also
 In Spanish: Corunna (Indiana) para niños

