Dayton, Wyoming facts for kids
Quick facts for kids
Dayton, Wyoming
|
|
|---|---|

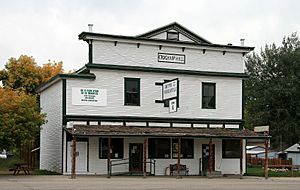
Crochan's Hall, Dayton
|
|

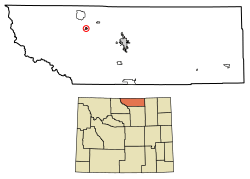
Location of Dayton in Sheridan County, Wyoming.
|
|
| Country | United States |
| State | Wyoming |
| County | Sheridan |
| Area | |
| • Total | 0.55 sq mi (1.42 km2) |
| • Land | 0.55 sq mi (1.42 km2) |
| • Water | 0.00 sq mi (0.00 km2) |
| Elevation | 3,921 ft (1,195 m) |
| Population
(2020)
|
|
| • Total | 757 |
| • Estimate
(2019)
|
822 |
| • Density | 1,376/sq mi (533.1/km2) |
| Time zone | UTC-7 (Mountain (MST)) |
| • Summer (DST) | UTC-6 (MDT) |
| ZIP code |
82836
|
| Area code(s) | 307 |
| FIPS code | 56-19385 |
| GNIS feature ID | 1587386 |
Dayton is a small town located in Sheridan County, Wyoming, in the United States. In 2020, about 822 people lived there. It's known for being a historic place where some important "firsts" happened in Wyoming!
Contents
History of Dayton
Dayton was named in 1882 after Joe Dayton Thorn, who was one of the people who helped start the town. This town holds a special place in Wyoming's history.
- Wyoming's First Rodeo: Did you know that the very first rodeo in Wyoming was held right here in Dayton? This exciting event took place in the 1890s.
- First Female Mayor: Dayton also made history by electing the first female mayor in Wyoming. This was a big step for women in leadership!
For a while, from 1989 to 2014, Dayton was home to the San Benito Monastery. This was a Roman Catholic monastery connected with the Benedictine Sisters of Perpetual Adoration.
Geography and Location
Dayton is located where two rivers meet: the Tongue River and the Little Tongue River. It's also found along U.S. Route 14, just east of the impressive Big Horn Mountains.
The town covers an area of about 1.42 square kilometers (0.55 square miles), and all of it is land.
Climate in Dayton
Dayton has a type of weather called a warm-summer humid continental climate. This means it has warm summers and cold, snowy winters. On climate maps, this is often shown as "Dfb."
| Climate data for Dayton, Wyoming, 1991–2020 normals, extremes 2000–present | |||||||||||||
|---|---|---|---|---|---|---|---|---|---|---|---|---|---|
| Month | Jan | Feb | Mar | Apr | May | Jun | Jul | Aug | Sep | Oct | Nov | Dec | Year |
| Record high °F (°C) | 69 (21) |
71 (22) |
80 (27) |
85 (29) |
95 (35) |
107 (42) |
107 (42) |
102 (39) |
100 (38) |
90 (32) |
77 (25) |
76 (24) |
107 (42) |
| Mean maximum °F (°C) | 59.6 (15.3) |
57.1 (13.9) |
69.8 (21.0) |
78.7 (25.9) |
84.3 (29.1) |
93.1 (33.9) |
96.8 (36.0) |
96.0 (35.6) |
92.4 (33.6) |
80.9 (27.2) |
70.0 (21.1) |
58.1 (14.5) |
97.8 (36.6) |
| Mean daily maximum °F (°C) | 35.9 (2.2) |
38.1 (3.4) |
47.0 (8.3) |
55.3 (12.9) |
65.2 (18.4) |
75.1 (23.9) |
85.2 (29.6) |
84.3 (29.1) |
73.2 (22.9) |
58.9 (14.9) |
45.6 (7.6) |
35.7 (2.1) |
58.3 (14.6) |
| Daily mean °F (°C) | 23.1 (−4.9) |
25.0 (−3.9) |
33.5 (0.8) |
42.1 (5.6) |
51.3 (10.7) |
60.1 (15.6) |
68.2 (20.1) |
67.0 (19.4) |
56.8 (13.8) |
44.5 (6.9) |
31.9 (−0.1) |
22.9 (−5.1) |
43.9 (6.6) |
| Mean daily minimum °F (°C) | 10.2 (−12.1) |
12.0 (−11.1) |
20.0 (−6.7) |
28.8 (−1.8) |
37.5 (3.1) |
45.0 (7.2) |
51.2 (10.7) |
49.7 (9.8) |
40.3 (4.6) |
30.1 (−1.1) |
18.2 (−7.7) |
10.0 (−12.2) |
29.4 (−1.4) |
| Mean minimum °F (°C) | −15.9 (−26.6) |
−12.5 (−24.7) |
−0.9 (−18.3) |
11.8 (−11.2) |
25.1 (−3.8) |
35.0 (1.7) |
42.6 (5.9) |
39.5 (4.2) |
28.4 (−2.0) |
11.1 (−11.6) |
−3.9 (−19.9) |
−12.4 (−24.7) |
−21.8 (−29.9) |
| Record low °F (°C) | −26 (−32) |
−29 (−34) |
−27 (−33) |
−4 (−20) |
14 (−10) |
28 (−2) |
24 (−4) |
29 (−2) |
19 (−7) |
−9 (−23) |
−17 (−27) |
−39 (−39) |
−39 (−39) |
| Average precipitation inches (mm) | 0.82 (21) |
0.89 (23) |
1.49 (38) |
2.06 (52) |
3.36 (85) |
1.99 (51) |
1.16 (29) |
0.88 (22) |
1.55 (39) |
1.86 (47) |
1.15 (29) |
0.82 (21) |
18.03 (457) |
| Average snowfall inches (cm) | 10.8 (27) |
11.1 (28) |
12.0 (30) |
7.1 (18) |
1.4 (3.6) |
0.0 (0.0) |
0.0 (0.0) |
0.0 (0.0) |
0.3 (0.76) |
6.4 (16) |
7.5 (19) |
11.7 (30) |
68.3 (172.36) |
| Average precipitation days (≥ 0.01 in) | 6.7 | 6.8 | 8.2 | 10.3 | 11.2 | 9.8 | 6.5 | 5.7 | 6.9 | 8.8 | 6.6 | 6.6 | 94.1 |
| Average snowy days (≥ 0.1 in) | 5.7 | 6.1 | 4.8 | 2.8 | 0.4 | 0.0 | 0.0 | 0.0 | 0.2 | 1.9 | 4.0 | 6.5 | 32.4 |
| Source 1: NOAA | |||||||||||||
| Source 2: National Weather Service (mean maxima and minima 2006–2020) | |||||||||||||
Population of Dayton
The population of Dayton has changed over the years. Here's how many people have lived there during different census counts:
| Historical population | |||
|---|---|---|---|
| Census | Pop. | %± | |
| 1910 | 313 | — | |
| 1920 | 136 | −56.5% | |
| 1930 | 303 | 122.8% | |
| 1940 | 240 | −20.8% | |
| 1950 | 316 | 31.7% | |
| 1960 | 333 | 5.4% | |
| 1970 | 396 | 18.9% | |
| 1980 | 701 | 77.0% | |
| 1990 | 565 | −19.4% | |
| 2000 | 678 | 20.0% | |
| 2010 | 757 | 11.7% | |
| 2020 | 822 | 8.6% | |
| 2019 (est.) | 828 | 9.4% | |
| U.S. Decennial Census | |||
Dayton's Population in 2010
In 2010, the town had 757 people living in 308 households. About 32% of these households had children under 18. The average age of people in Dayton was 44.5 years old.
Education in Dayton
Students in Dayton attend public schools managed by Sheridan County School District #1. Dayton is home to Tongue River High School, which is one of two high schools in the district.
See also
 In Spanish: Dayton (Wyoming) para niños
 | Kyle Baker |
 | Joseph Yoakum |
 | Laura Wheeler Waring |
 | Henry Ossawa Tanner |


