
Demography of England facts for kids
The demography of England looks at how the population of England has changed over time. Since 1801, the government has counted everyone living in England every ten years through a special survey called a national census. This helps us see how the population has grown and how more and more people have moved to cities over the centuries. In 2021, the population of England was 56,489,800 people.
Quick facts for kids Demographics of England |
|
|---|---|

Population pyramid of England in 2020
|
|
| Population | 56,489,800 |
| Density | 434/km2 (1,120/sq mi) |
| Fertility rate | 1.61 (2021) |
| Age structure | |
| 0–14 years | 17.4% (2021) |
| 15–64 years | 64.1% |
| 65 and over | 18.6% |
| Nationality | |
| Nationality | English (2021) |
| Major ethnic |
|
| Minor ethnic |
|
| Language | |
| Spoken | British English |

.png)
Contents
Population Numbers
The most recent count of people in England was in 2021. The population was found to be 56,489,800. This is a bit more than the 53,012,456 people counted in the previous census in 2011.
Here's a quick look at the 2021 numbers:
- Female: 28,833,712
- Male: 27,656,336
- Total population: 56,489,800
- The average number of children a woman is expected to have (Total Fertility Rate) was 1.61 in 2021.
How the Population Has Changed Over Time

England's population has changed a lot throughout history. For a long time, it was quite small. For example, around 5000 BC, there were fewer than 6,000 people. By 100 BC, it had grown to about 1.5 million.
During the Middle Ages, the population grew steadily, reaching about 4.8 million by 1348. However, the terrible Black Death plague in the mid-1300s caused a huge drop, reducing the population to around 2.6 million by 1351. It took a long time for numbers to recover.
From the 1800s onwards, England's population grew very quickly, especially with the Industrial Revolution. In 1801, there were about 8.3 million people. This number kept climbing, reaching over 30 million by 1901 and over 56 million by 2021.
Births and Deaths
Looking at how many babies are born and how many people die helps us understand population changes. In recent years, England has generally seen more births than deaths, meaning the population grows naturally. However, the number of births has been going down slightly. For example, in 2020, there were 585,195 live births and 569,700 deaths.
In 2022, about 36.7% of babies born in England had at least one parent who was born outside the UK. About 31.1% of all babies were born to mothers from outside the UK.
Age Groups
The age of people in England has been changing. In 2001, the average age was about 38.6 years. Here's how the population was divided by age in the 2011 census:
- 0–14 years (children and young teens): 17.7%
- 15–64 years (working age): 64.1%
- 65 years and over (older adults): 18.2%
This shows that England has a growing number of older people, which is a common trend in many developed countries.
Where People Were Born
Most people in England were born in the UK. However, a growing number of people were born in other countries. In 2021, about 80.3% of people in England were born in England itself.
Here are some of the largest groups of people born outside the UK, based on estimates:
 India: Around 832,000 people in 2018.
 Poland: Around 832,000 people in 2018.
 Pakistan: Around 535,000 people in 2018.
 Republic of Ireland: Around 369,000 people in 2018.
 Germany: Around 309,000 people in 2018.
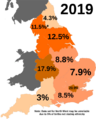
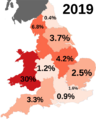
Different Ethnic Backgrounds


England is a diverse country with many different ethnic groups. The number of people from non-White backgrounds has been increasing over the years.
Here's a look at the main ethnic groups in England:
- White: In 2021, 81% of the population was White. This includes White British (73.5%), White Irish (0.9%), and other White groups (6.3%). The percentage of White British people has been slowly decreasing over time.
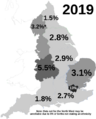
- Asian or Asian British: This group made up 9.7% of the population in 2021. The largest Asian groups are Indian (3.3%), Pakistani (2.8%), and Bangladeshi (1.1%).
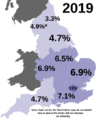
- Black or Black British: This group was 4.2% of the population in 2021. It includes Caribbean (1.1%) and African (2.6%) backgrounds.
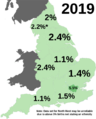
- Mixed: People of mixed ethnic backgrounds made up 2.9% of the population in 2021.
- Other Ethnic Groups: This category includes groups like Arab and other ethnic backgrounds, making up 2.2% in 2021.
The diversity of England's population is also seen in schools. The percentage of White British students has been going down, while the number of students from other ethnic groups has been rising since 2002. For example, in the 2021/2022 school year, White British students made up 63.9% of pupils, down from 80.3% in 2004.
Languages Spoken

While English is the main language spoken by almost everyone in England (92.02% in 2011), many other languages are also common. This shows the rich mix of cultures in the country.
Some of the most spoken languages after English include:
Religions

Religion in England (2021 census) Christianity (46.3%) Not religious (36.7%) Islam (6.7%) Not stated (6.0%) Other religions (2.5%) Hinduism (1.8%)
The religious landscape of England has also changed over time. In the 2021 census, the main religions reported were:
- Christianity: 46.3% of the population identified as Christian. This is a decrease from 71.74% in 2001.
- No religion: A growing number of people, 36.7%, stated they had no religion. This was only 14.59% in 2001.
- Islam: 6.7% of the population identified as Muslim, an increase from 3.10% in 2001.
- Hinduism: 1.8% of the population identified as Hindu.
- Sikhism: 0.9% of the population identified as Sikh.
- Jewish: 0.5% of the population identified as Jewish.
- Buddhism: 0.5% of the population identified as Buddhist.
- Other religions: 0.6% belonged to other religions.
- Religion not stated: 6.0% chose not to state their religion.
Images for kids
-
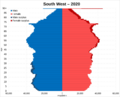
South West population pyramid 2020
-
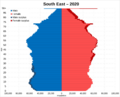
South East population pyramid 2020
-
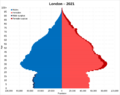
Greater London population pyramid
-
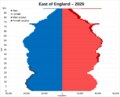
East of England population pyramid 2020
-
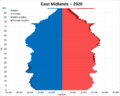
East Midlands population pyramid 2020
-
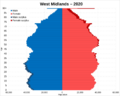
West Midlands population pyramid 2020
-
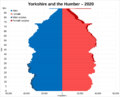
Yorkshire and the Humber population pyramid 2020
-
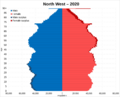
North West population pyramid 2020
-
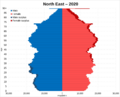
North East population pyramid 2020
-
Other White (4.6%)
-
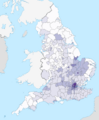
Asian/Asian British: Indian (2.6%)
-
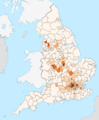
Asian/Asian British: Pakistani (2.1%)
-
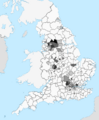
Asian/Asian British: Bangladeshi (0.8%)
-
Black/Black British: Total (3.5%)
-
Other: Arab (0.4%)
-
White births in England
-
Asian births in England
-
Black births in England
-
Mixed births
-
All other ethnic groups births
-
Births which did not state an ethnicity
-
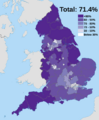
White: 71.4% of school children in England (2021/2022)
-
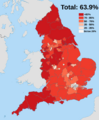
White British: 63.9% of school children in England (2021/2022)


See also
- Demographics of the United Kingdom
- Demography of Scotland
- Demography of Wales
- Demography of Northern Ireland
- Demography of London
- Demography of Birmingham
- Demography of Greater Manchester
- United Kingdom Census 2011
- List of English districts by population
- List of urban areas in England by population
- List of towns and cities in England by historical population
- List of major settlements by population in English counties
