
Growth-share matrix facts for kids
The growth-share matrix (also known as the B.C.G. matrix or Boston Consulting Group analysis) is a helpful chart that companies use to look at their different products or parts of their business. It was created in 1970 by Bruce Henderson for the Boston Consulting Group. This tool helps companies decide where to put their money and effort, making it useful in brand marketing, managing products, and planning for the future.
Contents
The growth-share matrix is like a map for businesses. It helps big companies understand how well their different products are doing. Imagine a company that sells many things, like phones, computers, and headphones. This matrix helps them see which products are growing fast and which ones are making a lot of money.
How Does the Matrix Work?
The matrix is a simple chart with two main parts, or axes:
- Market Growth Rate: This shows how fast the market for a product is growing. Is it a new, exciting market with lots of new customers, or is it an older market that isn't growing much?
- Relative Market Share: This shows how much of the market a company's product controls compared to its biggest competitors. Does the company sell a lot more of this product than anyone else, or just a little bit?
These two parts create four different sections, or "quadrants," on the matrix. Each section has a special name and suggests what a company should do with the products in that section.
Stars
Products in the "Stars" section are in markets that are growing very fast, and the company has a big share of that market. Think of a brand-new, super popular video game console when it first comes out.
- What they are: These products are leaders in exciting, growing markets.
- What companies do: Companies need to invest a lot of money to keep these products growing and stay ahead of competitors. The goal is for Stars to become "Cash Cows" later.
Cash Cows
"Cash Cows" are products in slow-growing markets, but the company has a very large share of that market. Imagine a classic, popular soft drink that everyone still buys.
- What they are: These products make a lot of money with little investment. They are very successful and well-known.
- What companies do: Companies "milk" these products for cash, meaning they take the profits and use them to invest in "Stars" or "Question Marks."
Question Marks
"Question Marks" are products in fast-growing markets, but the company has a small share of the market. Think of a new type of electric scooter that's just starting to get popular, but many companies are trying to sell them.
- What they are: These products have high potential because their market is growing, but they are not yet leaders. They are a bit of a gamble.
- What companies do: Companies must decide whether to invest a lot to turn them into "Stars" or to stop investing and let them become "Dogs."
Dogs
"Dogs" are products in slow-growing markets, and the company has a small share of that market. An example might be an old type of music player that very few people buy anymore.
- What they are: These products don't make much money and don't have much potential for growth.
- What companies do: Companies usually try to sell these products off, stop making them, or try to make them more efficient. They don't want to waste money on "Dogs."
Why Companies Use It
The growth-share matrix helps companies:
- Allocate Resources: Decide where to spend their money, time, and effort. Should they put more money into a "Star" product or try to fix a "Question Mark"?
- Plan for the Future: Understand which products might be successful in the future and which ones might need to be stopped.
- Balance Their Portfolio: Make sure they have a good mix of products – some making lots of cash (Cash Cows), some growing fast (Stars), and some with potential (Question Marks).
Images for kids
-
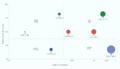
Stylised example of a BCG matrix. The products with the same colour belong to the same market. The products with a black outline indicate the products that belong to the own company. The chart was created with the online tool Fancy BCG Matrix.

See also
- Marketing
 In Spanish: Matriz BCG para niños
