Gurindji, Northern Territory facts for kids
Quick facts for kids GurindjiNorthern Territory |
|||||||||||||||
|---|---|---|---|---|---|---|---|---|---|---|---|---|---|---|---|
| Population | 17 (2016 census) | ||||||||||||||
| • Density | 0.000525/km2 (0.00136/sq mi) | ||||||||||||||
| Established | 4 April 2007 | ||||||||||||||
| Postcode(s) | 0852 | ||||||||||||||
| Elevation | 196 m (643 ft)(weather station) | ||||||||||||||
| Area | 32,372 km2 (12,498.9 sq mi) | ||||||||||||||
| Time zone | ACST (UTC+9:30) | ||||||||||||||
| Location | 549 km (341 mi) S of Darwin | ||||||||||||||
| LGA(s) |
|
||||||||||||||
| Territory electorate(s) | Gwoja | ||||||||||||||
| Federal Division(s) | Lingiari | ||||||||||||||
|
|||||||||||||||
|
|||||||||||||||
| Footnotes | Adjoining localities | ||||||||||||||
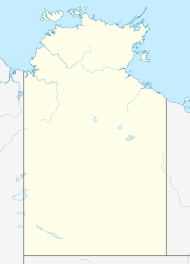
Gurindji is a place in the Northern Territory of Australia. It is located about 459 kilometers south of Darwin. Darwin is the capital city of the Northern Territory.
Gurindji covers a large area of land. This area includes different types of land. Some parts are Aboriginal Land Trusts. These are lands owned by Aboriginal people. Other parts are pastoral leases, which are used for farming animals. The area also includes land at the northern end of the Central Desert Aboriginal Land Trust.
Gurindji completely surrounds three communities. These communities are Daguragu, Kalkarindji, and Lajamanu. As of 2020, Gurindji covers about 32,372 square kilometers.
About Gurindji's Name and History
How Gurindji Got Its Name
The borders and name for Gurindji were officially set on April 4, 2007. The name "Gurindji" comes from the Gurindji Aboriginal people. They are famous for a protest they made a long time ago.
The Wave Hill Walk-Off
The Gurindji people walked off the Wave Hill Pastoral Station. They did this to protest against not being paid fairly for their work. This event is known as the Gurindji Wave Hill Walk Off Route. It is a very important historical site. It was added to the Northern Territory Heritage Register on October 27, 2006. This means it is a protected place because of its history.
People Living in Gurindji
In August 2016, a count of people was done. This count is called the 2016 Australian census. It showed that 17 people lived within the Gurindji area.
Government and Local Areas
Gurindji is part of different government areas. These areas help manage the region.
Federal and Territory Government
For federal elections, Gurindji is in the Lingiari division. For territory elections, it is in the Stuart division. These divisions help people choose their representatives.
Local Government Areas
Gurindji is also part of two local government areas. These are the Central Desert Region and the Victoria Daly Region. Local governments help with services like roads and community facilities.
Climate in Gurindji
The climate in Gurindji can be very warm. It has a wet season and a dry season.
| Climate data for Wave Hill, elevation 196 m (643 ft), (1991–2020 normals, extremes 1973–2022) | |||||||||||||
|---|---|---|---|---|---|---|---|---|---|---|---|---|---|
| Month | Jan | Feb | Mar | Apr | May | Jun | Jul | Aug | Sep | Oct | Nov | Dec | Year |
| Record high °C (°F) | 45.0 (113.0) |
44.5 (112.1) |
43.5 (110.3) |
40.5 (104.9) |
38.3 (100.9) |
36.5 (97.7) |
36.6 (97.9) |
38.0 (100.4) |
41.5 (106.7) |
45.0 (113.0) |
45.6 (114.1) |
45.2 (113.4) |
45.6 (114.1) |
| Mean daily maximum °C (°F) | 37.0 (98.6) |
36.0 (96.8) |
35.6 (96.1) |
34.9 (94.8) |
31.2 (88.2) |
28.5 (83.3) |
28.8 (83.8) |
31.3 (88.3) |
35.8 (96.4) |
38.0 (100.4) |
38.9 (102.0) |
37.9 (100.2) |
34.5 (94.1) |
| Mean daily minimum °C (°F) | 24.6 (76.3) |
24.0 (75.2) |
22.3 (72.1) |
19.2 (66.6) |
15.1 (59.2) |
11.8 (53.2) |
11.1 (52.0) |
12.5 (54.5) |
18.3 (64.9) |
21.8 (71.2) |
24.1 (75.4) |
24.7 (76.5) |
19.1 (66.4) |
| Record low °C (°F) | 15.5 (59.9) |
16.4 (61.5) |
11.7 (53.1) |
5.0 (41.0) |
3.4 (38.1) |
1.3 (34.3) |
0.0 (32.0) |
0.1 (32.2) |
6.0 (42.8) |
9.4 (48.9) |
12.9 (55.2) |
16.1 (61.0) |
0.0 (32.0) |
| Average rainfall mm (inches) | 159.8 (6.29) |
179.4 (7.06) |
110.6 (4.35) |
18.6 (0.73) |
8.0 (0.31) |
3.5 (0.14) |
3.2 (0.13) |
1.3 (0.05) |
12.8 (0.50) |
24.3 (0.96) |
52.4 (2.06) |
117.2 (4.61) |
691.1 (27.19) |
| Average rainy days (≥ 1.0 mm) | 10.6 | 10.8 | 6.5 | 1.3 | 1.0 | 0.3 | 0.3 | 0.1 | 0.9 | 3.1 | 5.2 | 9.3 | 49.4 |
| Source: Australian Bureau of Meteorology | |||||||||||||
 | Percy Lavon Julian |
 | Katherine Johnson |
 | George Washington Carver |
 | Annie Easley |


