Isobar facts for kids

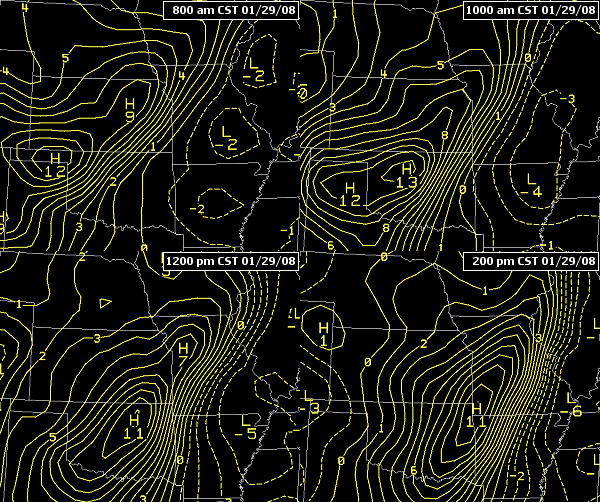
An isobar is a line on a weather map that connects places with the same atmospheric pressure. Think of it like the lines on a map that show places with the same height above sea level, but instead, isobars show places with the same "weight" of air pressing down.
Meteorologists (weather scientists) draw these lines to help them understand and predict the weather. They adjust the pressure readings to what they would be at sea level, so all measurements are fair and can be compared easily.
Contents
What Are Isobars?
The word "isobar" comes from ancient Greek words meaning "equal weight." On a weather map, an isobar is a line that joins all the points where the air pressure is exactly the same at a specific time. These lines help us see patterns in the atmosphere.
Air pressure is the force that the air around us pushes down with. It changes all the time, and these changes affect our weather. Isobars help us visualize these changes across a large area.
How Do Isobars Help Us Understand Weather?
Isobars are super important for understanding weather patterns. When you look at a weather map, you'll see these lines. Where the isobars are close together, it means the pressure is changing quickly over a short distance. This usually means strong winds!
Where the isobars are far apart, the pressure changes slowly, and the winds are usually lighter. By looking at how these lines are shaped and spaced, meteorologists can tell us a lot about the weather coming our way.
High and Low Pressure Systems
Isobars help us spot areas of high pressure and low pressure.
- High-pressure systems usually mean clear skies, calm weather, and sunshine. The isobars around a high-pressure center form circles, with the highest pressure in the middle.
- Low-pressure systems often bring cloudy skies, rain, or even storms. The isobars around a low-pressure center also form circles, but with the lowest pressure in the middle.
Drawing Isobars: How Does It Work?
To draw isobars, meteorologists collect pressure readings from many different weather stations around the world. These stations measure the atmospheric pressure at their location.
Once they have all the readings, they mark them on a map. Then, they draw lines connecting all the points that have the same pressure value. For example, one isobar might connect all places with 1012 millibars of pressure, while another connects all places with 1008 millibars.
Standard Pressure Units
Atmospheric pressure is usually measured in units called millibars (mb) or hectopascals (hPa). These units are basically the same, so 1 millibar equals 1 hectopascal. Normal sea-level pressure is around 1013 millibars.
Isobars and Wind Speed
The spacing of isobars on a map tells us about wind speed.
- When isobars are packed closely together, it means there's a big difference in pressure over a short distance. This creates a strong "pressure gradient," which leads to strong winds.
- When isobars are spread far apart, the pressure changes slowly, and the winds are usually light and gentle.
Winds generally blow from areas of high pressure to areas of low pressure. However, because of the Earth's rotation (this is called the Coriolis effect), winds don't blow straight across the isobars. Instead, they tend to blow almost parallel to them, circling around high and low-pressure centers.
 | Isaac Myers |
 | D. Hamilton Jackson |
 | A. Philip Randolph |

