Köping Municipality facts for kids
Quick facts for kids
Köping Municipality
Köpings kommun
|
|||
---|---|---|---|
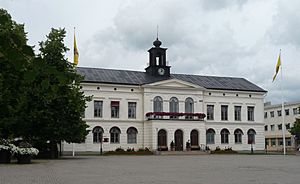
Köping Town Hall
|
|||
|
|||
Country | Sweden | ||
County | Västmanland County | ||
Seat | Köping | ||
Area | |||
• Total | 648.88 km2 (250.53 sq mi) | ||
• Land | 607.76 km2 (234.66 sq mi) | ||
• Water | 41.12 km2 (15.88 sq mi) | ||
Area as of January 1, 2010. | |||
Population
(June 30, 2012)
|
|||
• Total | 24,923 | ||
• Density | 38.4093/km2 (99.4795/sq mi) | ||
Time zone | UTC+1 (CET) | ||
• Summer (DST) | UTC+2 (CEST) | ||
ISO 3166 code | SE | ||
Province | Västmanland | ||
Municipal code | 1983 | ||
Website | www.koping.se |
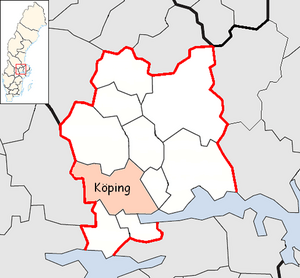
Köping Municipality (Swedish: Köpings kommun) is a municipality in Västmanland County in central Sweden. Its seat is located in the city of Köping.
The municipality was created in 1971, when the former City of Köping was merged with the municipalities of Kolsva, Medåker and Munktorp forming a new municipality of unitary type.
Contents
Localities
- Kolsva
- Munktorp
- Köping (seat)
Demographics
This is a demographic table based on Köping Municipality's electoral districts in the 2022 Swedish general election sourced from SVT's election platform, in turn taken from SCB official statistics.
In total there were 26,115 residents, including 19,584 Swedish citizens of voting age. 46.0% voted for the left coalition and 53.0% for the right coalition. Indicators are in percentage points except population totals and income.
Location | Residents | Citizen adults |
Left vote | Right vote | Employed | Swedish parents |
Foreign heritage |
Income SEK |
Degree |
---|---|---|---|---|---|---|---|---|---|
% | % | ||||||||
Byjorden-Odensvi | 2,240 | 1,712 | 43.3 | 54.6 | 73 | 71 | 29 | 22,353 | 25 |
Elund-Ållesta | 2,134 | 1,603 | 40.2 | 59.6 | 89 | 85 | 15 | 30,421 | 39 |
Hästhagen | 2,008 | 1,560 | 40.7 | 58.0 | 89 | 83 | 17 | 29,045 | 39 |
Karlberg | 1,852 | 1,417 | 41.4 | 57.5 | 74 | 74 | 26 | 25,384 | 29 |
Karlsdal | 1,859 | 1,460 | 49.8 | 49.0 | 73 | 63 | 37 | 22,020 | 27 |
Kolsva V | 1,933 | 1,521 | 42.8 | 55.8 | 78 | 82 | 18 | 23,332 | 30 |
Kolsva Ö | 1,601 | 1,177 | 39.6 | 59.7 | 79 | 78 | 22 | 24,366 | 24 |
Munktorp | 1,821 | 1,431 | 42.4 | 56.9 | 88 | 91 | 9 | 28,198 | 35 |
Nyckelberget | 1,955 | 1,431 | 47.9 | 51.2 | 75 | 64 | 36 | 23,605 | 36 |
Nygård-Skogsbrynet | 1,851 | 1,004 | 73.8 | 24.7 | 56 | 27 | 73 | 15,334 | 14 |
Skogsborg | 1,682 | 1,247 | 49.5 | 49.4 | 75 | 59 | 41 | 22,569 | 29 |
Tunadal | 1,826 | 1,426 | 53.1 | 45.8 | 67 | 65 | 35 | 18,458 | 25 |
Ullvi | 1,450 | 1,139 | 45.2 | 54.4 | 87 | 68 | 32 | 28,750 | 33 |
Östanås | 1,903 | 1,456 | 47.0 | 52.2 | 81 | 74 | 26 | 24,463 | 30 |
Source: SVT |
Riksdag elections
Year | % | Votes | V | S | MP | C | L | KD | M | SD | NyD | Left | Right |
---|---|---|---|---|---|---|---|---|---|---|---|---|---|
1973 | 90.5 | 16,091 | 5.3 | 54.1 | 23.6 | 6.7 | 2.2 | 7.3 | 59.5 | 37.5 | |||
1976 | 91.7 | 16,913 | 4.0 | 53.5 | 23.1 | 8.2 | 1.8 | 8.8 | 57.5 | 40.2 | |||
1979 | 90.3 | 16,811 | 5.6 | 54.3 | 17.5 | 8.3 | 1.6 | 12.0 | 59.8 | 37.8 | |||
1982 | 91.6 | 17,217 | 5.8 | 56.5 | 1.2 | 15.1 | 4.7 | 1.9 | 14.5 | 62.4 | 34.3 | ||
1985 | 88.7 | 16,986 | 6.0 | 55.1 | 1.2 | 12.3 | 10.5 | 13.0 | 61.1 | 35.8 | |||
1988 | 84.4 | 16,156 | 6.9 | 52.5 | 4.8 | 10.7 | 9.9 | 2.6 | 10.8 | 64.2 | 31.4 | ||
1991 | 84.9 | 16,164 | 5.5 | 48.5 | 2.7 | 8.1 | 7.5 | 6.7 | 14.7 | 5.9 | 54.1 | 37.0 | |
1994 | 86.0 | 16,328 | 8.5 | 54.1 | 5.4 | 8.9 | 6.0 | 2.8 | 15.4 | 0.9 | 66.5 | 31.1 | |
1998 | 79.3 | 14,575 | 16.2 | 44.1 | 3.5 | 5.6 | 3.2 | 9.6 | 16.0 | 63.8 | 34.4 | ||
2002 | 77.3 | 14,046 | 9.9 | 48.8 | 3.3 | 7.0 | 10.3 | 6.8 | 11.0 | 0.9 | 62.0 | 35.1 | |
2006 | 78.9 | 14,556 | 6.6 | 45.1 | 3.3 | 8.6 | 5.6 | 5.0 | 19.9 | 3.4 | 55.1 | 39.1 | |
2010 | 82.6 | 15,546 | 6.8 | 41.0 | 5.1 | 6.4 | 5.4 | 3.9 | 23.5 | 7.0 | 52.8 | 39.1 | |
2014 | 83.9 | 15,938 | 5.6 | 40.7 | 4.0 | 6.0 | 3.7 | 3.1 | 17.4 | 17.4 | 50.2 | 30.3 | |
2018 | 85.9 | 16,390 | 6.4 | 34.6 | 2.3 | 6.7 | 3.3 | 5.9 | 15.6 | 23.9 | 50.0 | 48.8 |
See also
In Spanish: Municipio de Köping para niños