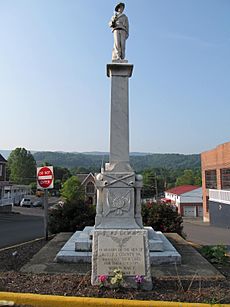
Lebanon, Virginia facts for kids
Quick facts for kids
Lebanon
|
||
|---|---|---|
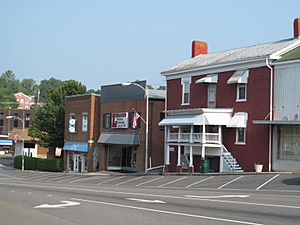
Downtown Lebanon (2012)
|
||
|
||
| Nickname(s):
"Heart of Southwest Virginia"
|
||
| Motto(s):
"Progressing for the Future"
|
||
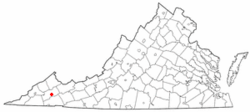
Location in Virginia
|
||
| Country | United States | |
| State | Virginia | |
| County | Russell | |
| Area | ||
| • Total | 4.83 sq mi (12.52 km2) | |
| • Land | 4.82 sq mi (12.47 km2) | |
| • Water | 0.02 sq mi (0.05 km2) | |
| Elevation | 2,060 ft (628 m) | |
| Population
(2010)
|
||
| • Total | 3,424 | |
| • Estimate
(2019)
|
3,147 | |
| • Density | 653.45/sq mi (252.30/km2) | |
| U.S. Census Bureau, 2010 Population Estimates | ||
| Time zone | UTC−5 (EST) | |
| • Summer (DST) | UTC−4 (EDT) | |
| ZIP code |
24266
|
|
| Area code(s) | 276 | |
| FIPS code | 51-44696 | |
| GNIS feature ID | 1498504 | |
Lebanon is a friendly town located in Russell County, Virginia, in the United States. It's known as the "Heart of Southwest Virginia." In 2010, about 3,424 people lived here. Lebanon is also the county seat of Russell County. This means it's where the main government offices for the county are located.
Contents
History of Lebanon
Lebanon was officially started in 1818. It was created to be the new main town for Russell County. An important part of the town's early history was the founding of the Lebanon Lutheran Church in 1851 by Pastor Jacob Scherer.
Geography and Climate
Where is Lebanon Located?
Lebanon is in Russell County, Virginia. The town covers an area of about 4.1 square miles (10.6 square kilometers). All of this area is land.
What is Lebanon's Climate Like?
Lebanon has a humid subtropical climate. This means it has hot, humid summers and mild winters. It gets plenty of rain throughout the year. Sometimes, it can feel like a temperate oceanic climate because of cooler winter months.
| Climate data for Lebanon, Virginia (1991–2020 normals, extremes 1909–1913, 1989–present) | |||||||||||||
|---|---|---|---|---|---|---|---|---|---|---|---|---|---|
| Month | Jan | Feb | Mar | Apr | May | Jun | Jul | Aug | Sep | Oct | Nov | Dec | Year |
| Record high °F (°C) | 79 (26) |
79 (26) |
89 (32) |
89 (32) |
90 (32) |
99 (37) |
99 (37) |
94 (34) |
95 (35) |
92 (33) |
81 (27) |
76 (24) |
99 (37) |
| Mean maximum °F (°C) | 65.3 (18.5) |
67.9 (19.9) |
74.5 (23.6) |
82.1 (27.8) |
85.2 (29.6) |
89.1 (31.7) |
90.2 (32.3) |
89.3 (31.8) |
87.9 (31.1) |
81.1 (27.3) |
73.8 (23.2) |
66.5 (19.2) |
91.4 (33.0) |
| Mean daily maximum °F (°C) | 44.9 (7.2) |
48.4 (9.1) |
56.5 (13.6) |
66.9 (19.4) |
74.5 (23.6) |
81.2 (27.3) |
84.0 (28.9) |
83.2 (28.4) |
78.7 (25.9) |
68.1 (20.1) |
57.0 (13.9) |
48.2 (9.0) |
66.0 (18.9) |
| Daily mean °F (°C) | 33.9 (1.1) |
37.0 (2.8) |
44.0 (6.7) |
53.2 (11.8) |
61.5 (16.4) |
69.1 (20.6) |
72.5 (22.5) |
71.5 (21.9) |
65.9 (18.8) |
54.4 (12.4) |
44.0 (6.7) |
37.3 (2.9) |
53.7 (12.1) |
| Mean daily minimum °F (°C) | 22.9 (−5.1) |
25.6 (−3.6) |
31.4 (−0.3) |
39.5 (4.2) |
48.5 (9.2) |
56.9 (13.8) |
61.0 (16.1) |
59.7 (15.4) |
53.2 (11.8) |
40.8 (4.9) |
30.9 (−0.6) |
26.4 (−3.1) |
41.4 (5.2) |
| Mean minimum °F (°C) | 3.5 (−15.8) |
7.2 (−13.8) |
14.4 (−9.8) |
25.3 (−3.7) |
34.1 (1.2) |
45.6 (7.6) |
52.0 (11.1) |
51.0 (10.6) |
39.9 (4.4) |
26.1 (−3.3) |
17.2 (−8.2) |
10.5 (−11.9) |
−0.2 (−17.9) |
| Record low °F (°C) | −18 (−28) |
−24 (−31) |
−6 (−21) |
14 (−10) |
26 (−3) |
37 (3) |
41 (5) |
43 (6) |
27 (−3) |
14 (−10) |
8 (−13) |
−2 (−19) |
−24 (−31) |
| Average precipitation inches (mm) | 3.49 (89) |
3.68 (93) |
4.18 (106) |
4.12 (105) |
4.42 (112) |
4.31 (109) |
4.86 (123) |
4.04 (103) |
3.34 (85) |
2.55 (65) |
3.01 (76) |
3.94 (100) |
45.94 (1,167) |
| Average snowfall inches (cm) | 4.4 (11) |
2.8 (7.1) |
2.5 (6.4) |
0.0 (0.0) |
0.0 (0.0) |
0.0 (0.0) |
0.0 (0.0) |
0.0 (0.0) |
0.0 (0.0) |
0.2 (0.51) |
0.5 (1.3) |
2.0 (5.1) |
12.4 (31) |
| Average precipitation days (≥ 0.01 in) | 12.3 | 11.9 | 13.6 | 12.4 | 14.0 | 12.6 | 13.2 | 11.3 | 8.6 | 9.1 | 9.5 | 12.7 | 141.2 |
| Average snowy days (≥ 0.1 in) | 2.5 | 2.0 | 1.3 | 0.1 | 0.0 | 0.0 | 0.0 | 0.0 | 0.0 | 0.1 | 0.4 | 1.7 | 8.1 |
| Source: NOAA | |||||||||||||
People of Lebanon
Population Over Time
| Historical population | |||
|---|---|---|---|
| Census | Pop. | %± | |
| 1860 | 264 | — | |
| 1870 | 209 | −20.8% | |
| 1880 | 244 | 16.7% | |
| 1890 | 310 | 27.0% | |
| 1900 | 325 | 4.8% | |
| 1910 | 366 | 12.6% | |
| 1920 | 469 | 28.1% | |
| 1930 | 560 | 19.4% | |
| 1940 | 622 | 11.1% | |
| 1950 | 672 | 8.0% | |
| 1960 | 2,085 | 210.3% | |
| 1970 | 2,272 | 9.0% | |
| 1980 | 3,206 | 41.1% | |
| 1990 | 3,386 | 5.6% | |
| 2000 | 3,273 | −3.3% | |
| 2010 | 3,424 | 4.6% | |
| 2019 (est.) | 3,147 | −8.1% | |
| U.S. Decennial Census | |||
The population of Lebanon has changed quite a bit over the years. You can see how the number of people living in the town has grown from 1860 to 2010 in the chart. In 2010, there were 3,424 people living in Lebanon.
Who Lives in Lebanon?
In 2010, there were 3,424 people living in Lebanon. Most of the people were White (about 94.7%). About 2.9% were African American, and smaller groups were Native American or from other backgrounds. About 1.4% of the population was Hispanic or Latino.
There were 1,507 households in the town. A household is a group of people living together. About 23.7% of these households had children under 18. Many households (41.0%) were married couples living together.
The average age of people in Lebanon was 41 years old. About 21% of the population was under 18, and 20% were 65 or older.
Arts and Culture in Lebanon
Historical Places to See
Lebanon has several interesting historical sites. These places are listed on the National Register of Historic Places. This means they are important to the history of the country and are protected. Some of these sites include:
- Blackford Bridge
- Carter Hill
- Daugherty's Cave and Breeding Site
- Samuel Gilmer House
- Stephen B. Quillen House
Unique Restaurants
Lebanon is home to something quite special: it has one of only four Bonanza restaurants in the entire country! It's the only one located in the Southern United States.
See also
 In Spanish: Lebanon (Virginia) para niños
 | Lonnie Johnson |
 | Granville Woods |
 | Lewis Howard Latimer |
 | James West |


