Litoral del San Juan facts for kids
Quick facts for kids
Litoral del San Juan
|
|||
|---|---|---|---|
|
Municipality and town
|
|||
|
|||

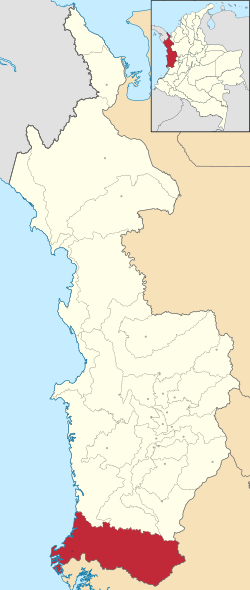
Location of the municipality and town of Litoral del Sanjuán in the Chocó Department of Colombia.
|
|||
| Country | |||
| Department | Chocó Department | ||
| Area | |||
| • Total | 3,755 km2 (1,450 sq mi) | ||
| Population
(Census 2018)
|
|||
| • Total | 11,579 | ||
| • Density | 3.0836/km2 (7.9865/sq mi) | ||
| Time zone | UTC-5 (Colombia Standard Time) | ||
Litoral del San Juan is a special place in Colombia. It is both a town and a municipality. A municipality is like a local government area. It is located in the Chocó Department.
Contents
Discovering Litoral del San Juan
Litoral del San Juan is a vibrant community. It is home to about 11,579 people. This number comes from the 2018 census. The area covers about 3,755 square kilometers. That's a lot of space!
Where is it Located?
This municipality is found in the Chocó Department. Chocó is a department in western Colombia. It is known for its beautiful natural areas. Litoral del San Juan is close to the San Juan River. This river is very important to the region.
Understanding the Climate
Litoral del San Juan has a very special climate. It is known as an extremely wet tropical rainforest climate. This means it gets a lot of rain all year long. Imagine living in a place where it rains almost every day!
Rainfall and Temperatures
The capital of the municipality is Santa Genoveva de Docordó. The weather data below is for this town. Temperatures stay warm and steady throughout the year. They usually range from about 22°C to 30°C. The rainfall is incredibly high. Some months get over 800 millimeters of rain! This constant rain helps create a lush rainforest environment.
| Climate data for Docordó | |||||||||||||
|---|---|---|---|---|---|---|---|---|---|---|---|---|---|
| Month | Jan | Feb | Mar | Apr | May | Jun | Jul | Aug | Sep | Oct | Nov | Dec | Year |
| Mean daily maximum °C (°F) | 29.3 (84.7) |
29.6 (85.3) |
29.9 (85.8) |
30.0 (86.0) |
29.9 (85.8) |
29.6 (85.3) |
29.4 (84.9) |
29.0 (84.2) |
28.6 (83.5) |
28.1 (82.6) |
28.3 (82.9) |
28.6 (83.5) |
29.2 (84.5) |
| Daily mean °C (°F) | 25.8 (78.4) |
25.9 (78.6) |
26.2 (79.2) |
26.3 (79.3) |
26.3 (79.3) |
26.0 (78.8) |
25.9 (78.6) |
25.7 (78.3) |
25.4 (77.7) |
25.1 (77.2) |
25.2 (77.4) |
25.5 (77.9) |
25.8 (78.4) |
| Mean daily minimum °C (°F) | 22.3 (72.1) |
22.3 (72.1) |
22.6 (72.7) |
22.6 (72.7) |
22.7 (72.9) |
22.4 (72.3) |
22.4 (72.3) |
22.5 (72.5) |
22.3 (72.1) |
22.2 (72.0) |
22.2 (72.0) |
22.4 (72.3) |
22.4 (72.3) |
| Average rainfall mm (inches) | 374 (14.7) |
311 (12.2) |
365 (14.4) |
476 (18.7) |
630 (24.8) |
640 (25.2) |
660 (26.0) |
733 (28.9) |
794 (31.3) |
802 (31.6) |
767 (30.2) |
601 (23.7) |
7,153 (281.7) |
| Source: Climate-Data.org | |||||||||||||
See also
 In Spanish: Litoral del San Juan para niños
 | James B. Knighten |
 | Azellia White |
 | Willa Brown |


