Lloró facts for kids
Quick facts for kids
Lloró
|
|||
|---|---|---|---|
|
Municipality and town
|
|||
|
|||

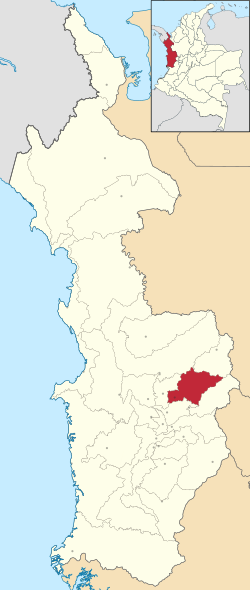
Location of the municipality and town of Lloró in the Chocó Department of Colombia.
|
|||
| Country | |||
| Department | Chocó Department | ||
| Founded | January 1, 1674 | ||
| Area | |||
| • Municipality and town | 905 km2 (349.42 sq mi) | ||
| Population
(2015)
|
|||
| • Municipality and town | 11,197 | ||
| • Density | 12.37/km2 (32.04/sq mi) | ||
| • Urban | 3,406 | ||
| Time zone | UTC-5 (Colombia Standard Time) | ||
Lloró is a town and municipality located in the Chocó Department of Colombia. It is famous for its incredibly high rainfall. Lloró claims to have one of the highest average annual rainfall amounts in the world, around 12,717 millimeters (about 500 inches). This data was collected at an agricultural farm near the town between 1952 and 1989. If these measurements are correct, it would make Lloró one of the wettest places on Earth! However, the official world record for rainfall is held by Mawsynram in India. The town's name comes from Gioró, an ancient indigenous chief.
In 1853, a famous artist named Manuel María Paz painted a watercolor showing two men and a woman selling drinks in Lloró.
Weather in Lloró
Lloró has a very wet tropical rainforest climate. This type of climate means it's hot and rainy all year round. The town itself gets about 8,000 millimeters of rain each year. However, a farm located to the east of the town records even more, with about 12,892.4 millimeters of rain annually.
| Climate data for Lloró, elevation 90 m (300 ft), (1981–2010) | |||||||||||||
|---|---|---|---|---|---|---|---|---|---|---|---|---|---|
| Month | Jan | Feb | Mar | Apr | May | Jun | Jul | Aug | Sep | Oct | Nov | Dec | Year |
| Mean daily maximum °C (°F) | 30.2 (86.4) |
30.5 (86.9) |
30.8 (87.4) |
30.8 (87.4) |
31.2 (88.2) |
31.1 (88.0) |
31.3 (88.3) |
31.3 (88.3) |
30.9 (87.6) |
30.6 (87.1) |
30.4 (86.7) |
30.2 (86.4) |
30.8 (87.4) |
| Daily mean °C (°F) | 26.1 (79.0) |
26.3 (79.3) |
26.4 (79.5) |
26.5 (79.7) |
26.6 (79.9) |
26.5 (79.7) |
26.5 (79.7) |
26.5 (79.7) |
26.4 (79.5) |
26.2 (79.2) |
26.1 (79.0) |
26.0 (78.8) |
26.3 (79.3) |
| Mean daily minimum °C (°F) | 23.4 (74.1) |
23.3 (73.9) |
23.1 (73.6) |
23.6 (74.5) |
23.3 (73.9) |
23.6 (74.5) |
23.4 (74.1) |
23.2 (73.8) |
23.3 (73.9) |
23.4 (74.1) |
23.1 (73.6) |
23.4 (74.1) |
23.3 (73.9) |
| Average precipitation mm (inches) | 579.7 (22.82) |
508.8 (20.03) |
541.4 (21.31) |
715.1 (28.15) |
759.2 (29.89) |
702.5 (27.66) |
746.0 (29.37) |
752.1 (29.61) |
753.2 (29.65) |
621.4 (24.46) |
728.3 (28.67) |
593.4 (23.36) |
7,806.5 (307.34) |
| Average precipitation days | 21 | 19 | 19 | 22 | 23 | 23 | 23 | 24 | 23 | 23 | 23 | 22 | 250 |
| Average relative humidity (%) | 91 | 90 | 90 | 90 | 89 | 89 | 89 | 89 | 89 | 90 | 90 | 91 | 90 |
| Source: Instituto de Hidrologia Meteorologia y Estudios Ambientales | |||||||||||||
Local Areas
The municipality of Lloró includes several smaller areas called corregimientos. These are like small villages or districts within the larger municipality. They include:
- El Cajón
- Carmen de Surama
- Irabubú
- La Playita
- San Lorenzo
- Sesego
- El Tigre
- Urabará
See also
 In Spanish: Lloró para niños
 | Stephanie Wilson |
 | Charles Bolden |
 | Ronald McNair |
 | Frederick D. Gregory |


