Loa, Utah facts for kids
Quick facts for kids
Loa, Utah
|
|
|---|---|
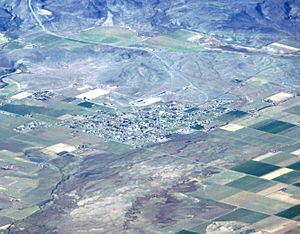
Aerial view of Loa
|
|
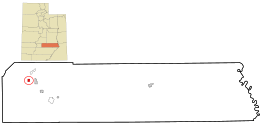
Location in Wayne County and the state of Utah.
|
|
| Country | United States |
| State | Utah |
| County | Wayne |
| Settled | 1878 |
| Named for | Mauna Loa |
| Area | |
| • Total | 0.95 sq mi (2.46 km2) |
| • Land | 0.95 sq mi (2.46 km2) |
| • Water | 0.00 sq mi (0.00 km2) |
| Elevation | 7,064 ft (2,153 m) |
| Population
(2010)
|
|
| • Total | 572 |
| • Estimate
(2019)
|
575 |
| • Density | 605.26/sq mi (233.72/km2) |
| Time zone | UTC−7 (Mountain (MST)) |
| • Summer (DST) | UTC−6 (MDT) |
| ZIP code |
84747
|
| Area code(s) | 435 |
| FIPS code | 49-45530 |
| GNIS feature ID | 1442822 |
Loa is a small town in Wayne County, Utah, United States. It is also the county seat, which means it's where the main government offices for the county are located. The town sits along State Route 24. In 2010, about 572 people lived there.
Contents
Discovering Loa's History
Loa got its name from a famous volcano in Hawaii called Mauna Loa. A Mormon missionary who had visited Hawaii named the town in 1878. A post office opened in Loa in 1879, helping the small community grow.
Exploring Loa's Geography and Climate
Loa covers about 0.9 square miles (2.3 square kilometers) of land. It does not have any large bodies of water within its borders.
Water Sources in Loa
The town gets its water from Spring Creek. This creek starts about 4 miles (6.4 km) north of Loa. Today, a state fish hatchery is located near the creek's source. The drinking water for Loa comes from a spring near Road Creek.
Understanding Loa's Climate
Loa has a cold semi-arid climate. This means it's generally dry, but it gets enough rain to support some plant life. It has cold winters and warm summers.
| Climate data for Loa, Utah, 1991–2020 normals, 1893-2020 extremes: 7070ft (2155m) | |||||||||||||
|---|---|---|---|---|---|---|---|---|---|---|---|---|---|
| Month | Jan | Feb | Mar | Apr | May | Jun | Jul | Aug | Sep | Oct | Nov | Dec | Year |
| Record high °F (°C) | 65 (18) |
70 (21) |
72 (22) |
80 (27) |
92 (33) |
98 (37) |
101 (38) |
100 (38) |
93 (34) |
84 (29) |
75 (24) |
67 (19) |
101 (38) |
| Mean maximum °F (°C) | 51.6 (10.9) |
55.6 (13.1) |
64.4 (18.0) |
73.2 (22.9) |
80.1 (26.7) |
88.6 (31.4) |
90.1 (32.3) |
88.2 (31.2) |
83.9 (28.8) |
75.8 (24.3) |
65.7 (18.7) |
54.3 (12.4) |
91.0 (32.8) |
| Mean daily maximum °F (°C) | 39.6 (4.2) |
42.6 (5.9) |
51.2 (10.7) |
58.0 (14.4) |
67.3 (19.6) |
78.3 (25.7) |
83.5 (28.6) |
81.3 (27.4) |
74.7 (23.7) |
62.7 (17.1) |
50.3 (10.2) |
39.7 (4.3) |
60.8 (16.0) |
| Daily mean °F (°C) | 24.6 (−4.1) |
28.1 (−2.2) |
35.8 (2.1) |
42.1 (5.6) |
51.1 (10.6) |
60.5 (15.8) |
66.9 (19.4) |
64.7 (18.2) |
56.8 (13.8) |
44.9 (7.2) |
33.9 (1.1) |
24.5 (−4.2) |
44.5 (6.9) |
| Mean daily minimum °F (°C) | 9.5 (−12.5) |
13.7 (−10.2) |
20.4 (−6.4) |
26.2 (−3.2) |
34.8 (1.6) |
42.7 (5.9) |
50.2 (10.1) |
48.2 (9.0) |
38.8 (3.8) |
27.2 (−2.7) |
17.6 (−8.0) |
9.3 (−12.6) |
28.2 (−2.1) |
| Mean minimum °F (°C) | −7.0 (−21.7) |
−2.8 (−19.3) |
6.9 (−13.9) |
14.3 (−9.8) |
23.2 (−4.9) |
32.2 (0.1) |
41.4 (5.2) |
39.7 (4.3) |
27.3 (−2.6) |
14.3 (−9.8) |
2.3 (−16.5) |
−6.2 (−21.2) |
−9.8 (−23.2) |
| Record low °F (°C) | −33 (−36) |
−37 (−38) |
−15 (−26) |
−3 (−19) |
10 (−12) |
19 (−7) |
19 (−7) |
23 (−5) |
10 (−12) |
−9 (−23) |
−18 (−28) |
−28 (−33) |
−37 (−38) |
| Average precipitation inches (mm) | 0.39 (9.9) |
0.45 (11) |
0.51 (13) |
0.50 (13) |
0.75 (19) |
0.57 (14) |
1.34 (34) |
1.37 (35) |
0.98 (25) |
0.84 (21) |
0.29 (7.4) |
0.42 (11) |
8.41 (213.3) |
| Average snowfall inches (cm) | 3.90 (9.9) |
5.40 (13.7) |
2.20 (5.6) |
0.70 (1.8) |
0.50 (1.3) |
0.00 (0.00) |
0.00 (0.00) |
0.00 (0.00) |
0.00 (0.00) |
0.40 (1.0) |
1.50 (3.8) |
4.60 (11.7) |
19.2 (48.8) |
| Source 1: NOAA | |||||||||||||
| Source 2: XMACIS2 (records & monthly max/mins) | |||||||||||||
Understanding Loa's Population
| Historical population | |||
|---|---|---|---|
| Census | Pop. | %± | |
| 1890 | 411 | — | |
| 1900 | 443 | 7.8% | |
| 1910 | 448 | 1.1% | |
| 1920 | 499 | 11.4% | |
| 1930 | 343 | −31.3% | |
| 1940 | 396 | 15.5% | |
| 1950 | 437 | 10.4% | |
| 1960 | 359 | −17.8% | |
| 1970 | 324 | −9.7% | |
| 1980 | 364 | 12.3% | |
| 1990 | 444 | 22.0% | |
| 2000 | 525 | 18.2% | |
| 2010 | 572 | 9.0% | |
| 2019 (est.) | 575 | 0.5% | |
| U.S. Decennial Census | |||
In 2000, Loa had 525 people living there. These people lived in 165 different homes, and 134 of these were families. The town had about 595 people per square mile.
Who Lives in Loa?
Most people in Loa are White (99.24%). A small number are Native American (0.38%) or Pacific Islander (0.38%). About 1.71% of the people identified as Hispanic or Latino.
Families and Age Groups
Many homes in Loa (46.1%) had children under 18 living there. Most homes (74.5%) were married couples. The average home had about 3.14 people.
The population of Loa is quite young. About 37% of the people were under 18 years old. The average age in Loa was 28 years. For every 100 females, there were about 99.6 males.
Income in Loa
In 2000, the average income for a household in Loa was $33,750 per year. For families, the average income was $35,341. About 11.7% of all people in Loa lived below the poverty line. This included 13.9% of those under 18 and 8.6% of those 65 or older.
Images for kids
See also
 In Spanish: Loa (Utah) para niños
 | Selma Burke |
 | Pauline Powell Burns |
 | Frederick J. Brown |
 | Robert Blackburn |


