
Logistic Regression facts for kids

Logistic Regression, sometimes called Logit Regression, is a special math tool used in statistics. It helps us guess the chance of something happening based on information we already have. Imagine you want to know if a sports team will win a game. Logistic Regression can help predict if they will win (we can call this a '1') or if they won't (a '0').
This method works best with "yes" or "no" questions. For example, will a student pass an exam? (Yes = 1, No = 0). This is called Binomial Logistic Regression. There's also Multinomial Logistic Regression for when there are more than two possible outcomes, like predicting if a customer will buy product A, B, or C.
Logistic Regression uses a special "S"-shaped curve to model the data. This curve is perfect because it always stays between 0 and 1. This makes it great for showing probabilities. It can predict events better than simpler methods like linear regression, especially when the outcome is a "yes" or "no" answer. It's used a lot in machine learning to make predictions from past information.
Contents
How Logistic Regression Works
Logistic Regression is a different way to predict things compared to Linear Regression. Linear Regression tries to find a straight line to guess future data. But Logistic Regression doesn't use a straight line. Instead, it uses a special math function to find the connections between different pieces of information. It then uses past data to figure out the best way to make predictions.
This method uses something called "odds ratios." This is a way to compare how likely an event is to happen versus how likely it is not to happen. Let's use our sports team example. If a team has a 75% chance (0.75) of winning, then they have a 25% chance (0.25) of losing. The odds of them winning would be 0.75 divided by 0.25, which equals 3. This means the team is 3 times more likely to win than to lose.
Logistic Regression takes these odds and turns them into an "S"-shaped curve. This curve helps show the probability of an event happening. For example, it can show how likely it is for 'y' (the event) to be '1' (it happens) for a given 'x' (some input information). The curve helps us see how the probability changes as the input information changes.
Where Logistic Regression is Used
Logistic Regression is a very useful tool in many areas. Here are some common ways it is used:
Predicting Outcomes
- Medicine: Doctors can use it to predict if a patient has a certain disease based on their symptoms or test results. For example, predicting if someone will get diabetes based on their diet and exercise.
- Business: Companies use it to guess if a customer will buy a product or if a loan applicant will pay back their loan. This helps them make smart decisions.
- Marketing: Marketers can predict if a person will click on an online ad. This helps them show the right ads to the right people.
Classifying Information
Logistic Regression is also great for sorting things into groups.
- Spam Detection: Email providers use it to decide if an email is spam (junk) or not. It looks at words and patterns in the email to make this decision.
- Image Recognition: In simpler cases, it can help classify images. For example, telling if a picture shows a cat or a dog.
By using the "S"-shaped curve, Logistic Regression helps us understand the chances of different events. It's a powerful tool for making predictions and sorting data in a world full of "yes" or "no" questions.
Images for kids
-
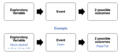
This picture shows what is part of logistic regression. It includes an input (like study hours), an event (like an exam), and two possible results (pass or fail). The input, event, and results can change depending on what you are trying to predict.

See also
 In Spanish: Regresión logística para niños
