
Linear regression facts for kids

Linear regression is a way to understand the connection between two or more things using a straight line. Imagine you have some data points, like how many hours someone studies and their test score. Linear regression helps you draw a line that best shows this relationship. It's a special type of regression analysis, which is a method for studying how variables relate to each other.
This method was one of the first and easiest types of regression analysis to be studied. This is because models that use straight lines are simpler to work with than those that use curved lines. Also, it's easier to figure out the statistical rules for the results you get from linear regression.
Linear regression is used in many real-world situations. Most uses fall into two main groups:
- It can help create a model to predict things based on data you already have. For example, if you have data on how much a plant grows each day, you can use linear regression to predict its future height. If you know a new value for one thing (like the number of days), the model can guess the value of the other thing (like the plant's height).
- It can help you figure out how strong the connection is between different things. For example, if you want to know how a person's height, age, and diet might affect their weight, linear regression can show which of these factors are most connected to weight. It can also help you see which factors might not be connected at all.
Linear regression models try to make the vertical distance between the straight line and the actual data points as small as possible. This is like trying to draw the "best fit" line through your dots. Often, this is done by making the sum of the squares of these distances as small as possible. This method is called "least squares".
What is Linear Regression Used For?
In Economics
Linear regression is a very important tool in economics. It helps people understand and predict many economic things. For example, it can be used to guess how much people will spend on goods and services. It can also help predict how much a country will buy from other countries (imports) or sell to other countries (exports). Economists use it to understand things like how much money people want to keep in their wallets or how many workers businesses might hire.
Related pages
Images for kids
-
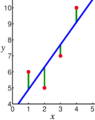
In linear regression, the observations (red) are assumed to be the result of random deviations (green) from an underlying relationship (blue) between a dependent variable (y) and an independent variable (x).
-
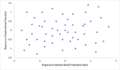
To check for violations of the assumptions of linearity, constant variance, and independence of errors within a linear regression model, the residuals are typically plotted against the predicted values (or each of the individual predictors). An apparently random scatter of points about the horizontal midline at 0 is ideal, but cannot rule out certain kinds of violations such as autocorrelation in the errors or their correlation with one or more covariates.
-
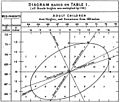
Francis Galton's 1886 illustration of the correlation between the heights of adults and their parents. The observation that adult children's heights tended to deviate less from the mean height than their parents suggested the concept of "regression toward the mean", giving regression its name. The "locus of horizontal tangential points" passing through the leftmost and rightmost points on the ellipse (which is a level curve of the bivariate normal distribution estimated from the data) is the OLS estimate of the regression of parents' heights on children's heights, while the "locus of vertical tangential points" is the OLS estimate of the regression of children's heights on parent's heights. The major axis of the ellipse is the TLS estimate.


See also
 In Spanish: Regresión lineal para niños
