
Multivariate normal distribution facts for kids
The multivariate normal distribution, also known as the multivariate Gaussian distribution, is a way to understand how several different measurements or numbers can be related to each other. Imagine you're measuring the height and weight of many students. A normal distribution (or "bell curve") describes how one measurement, like height, spreads out. The multivariate normal distribution helps us understand how both height and weight spread out together, and if they tend to change in similar ways (like taller kids often being heavier).
This idea is very important in statistics because it helps describe many real-world situations where different things are connected. For example, it can help describe how different features of a plant or animal might vary.
Contents
What is a Multivariate Normal Distribution?
Imagine you have a group of numbers, like the height, weight, and age of a person. If these numbers are "multivariate normally distributed," it means they follow a specific pattern.
- Mean Vector: This is like the average for each measurement. For height, weight, and age, it would be the average height, average weight, and average age. We call this the mean vector (a list of averages).
- Covariance Matrix: This is a special table that tells us how much each measurement changes with every other measurement. For example, it shows if height and weight usually go up or down together. If they do, they are "correlated."
When we write down a multivariate normal distribution, we often use a special symbol:
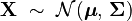
Here,  is your group of measurements,
  is the mean vector, and
  is the covariance matrix.
How it Looks: The Bell Curve in 3D

For a single measurement, the normal distribution looks like a bell curve. For two measurements (like height and weight), the multivariate normal distribution looks like a bell-shaped hill or mountain. The highest point of the hill is at the average values (the mean vector).
The shape of this "hill" depends on the covariance matrix.
- If the measurements are not related, the hill will be perfectly round or oval, like a smooth dome.
- If they are related (correlated), the hill will be stretched or squeezed in certain directions, like an elongated oval or a ridge.
The lines on the ground around the hill (called "iso-density loci") are like contour lines on a map. They show where the probability of finding a data point is the same. For two measurements, these lines are always ellipses.
What if Measurements are Connected?
Sometimes, the measurements are so strongly connected that they always fall on a line or a flat surface. For example, if you measure a person's height in inches and then again in centimeters, these two measurements are perfectly linked. In such a case, the distribution is called "degenerate," and it doesn't spread out in all directions.
Understanding Probabilities
The multivariate normal distribution helps us figure out the probability of a set of measurements falling within a certain area.
- Cumulative Distribution Function (CDF): This tells us the chance that all your measurements are less than or equal to certain values. For example, what's the probability that a student's height is less than 160 cm AND their weight is less than 50 kg?
- Intervals: We can also define regions where a certain percentage of the data is expected to fall. These regions are shaped like ellipses (or higher-dimensional ovals). For example, a region might contain 95% of all possible height and weight combinations.
Important Features
Joint Normality: When Variables Work Together
If you have two measurements, say X and Y, and they are both normally distributed and also completely independent (meaning one doesn't affect the other), then they are "jointly normally distributed." This means their combined behavior follows the multivariate normal distribution.
However, just because X and Y are both normally distributed doesn't automatically mean they are jointly normal. They might be related in a complicated way that doesn't fit the multivariate normal pattern.
- Correlations and Independence: A cool thing about the multivariate normal distribution is that if two measurements are uncorrelated (meaning they don't seem to change together), then they are also independent. This is not true for all types of distributions, but it's a special feature of the normal distribution.
Conditional Distributions: What if We Know Something?
Imagine you have measurements for height, weight, and age. If you know a student's age, how does that change what you expect their height and weight to be?
The "conditional distribution" tells us what the distribution of some measurements looks like, given that we already know the values of other measurements. For the multivariate normal distribution, if you know some parts of the data, the remaining parts will still follow a normal distribution, but with new average values and new relationships between them.
For example, if you know a student is 15 years old, their expected height and weight might be different from the overall average for all students.
Marginal Distributions: Looking at Parts of the Whole
If you have a group of measurements (like height, weight, and age) that are multivariate normally distributed, and you only want to look at a subset of them (like just height and weight), that subset will also be normally distributed. You just "ignore" the measurements you don't want to look at.
Affine Transformation: Changing the Scale
If you take your measurements and simply multiply them by a number or add a constant to them (like converting inches to centimeters, or adding 5 to everyone's score), the new measurements will still follow a multivariate normal distribution. Their new average and covariance matrix can be easily calculated from the old ones.
How We Use It
Estimating Parameters from Data
When we collect data, we often want to find the mean vector and covariance matrix that best describe our observations. We use methods like "maximum likelihood estimation" to find these values. Basically, we calculate the average of each measurement and how they vary together in our sample.
Testing for Normality
Sometimes, we want to check if a set of data truly looks like it came from a multivariate normal distribution. There are special "multivariate normality tests" that help us do this. These tests compare our data to what a perfect multivariate normal distribution would look like. If the data is very different, the test tells us it's probably not normally distributed.
Drawing Values from the Distribution
Scientists and statisticians often need to create fake data that follows a multivariate normal distribution. This is useful for simulations or testing theories. Computers can do this by: 1. Finding a special matrix (like a "recipe") from the covariance matrix. 2. Generating independent random numbers that follow a standard normal distribution (a simple bell curve). 3. Using the recipe matrix and these random numbers to create the desired multivariate normal data.
Images for kids
-
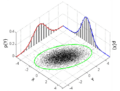
Many sample points from a multivariate normal distribution.
-
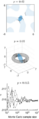
Probabilities of a multivariate normal distribution in different shapes.
-
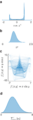
How probabilities change when you apply functions to normal vectors.
-

Classifying data points into different multivariate normal groups.

Error: no page names specified (help).
- Chi distribution: This describes the length of a vector when its parts are normally distributed and not related.
- Rayleigh distribution: A special case of the Chi distribution for two measurements that are not related.
- Rice distribution: Another special case for two measurements that are not related, but their average is not zero.
- Complex normal distribution: A special type of bivariate normal distribution used with complex numbers.
- Mahalanobis distance: A way to measure how far a point is from the center of a multivariate normal distribution, taking into account the spread and correlation of the data.
- Wishart distribution: Related to the covariance matrix itself.
- Matrix normal distribution: When you have a whole matrix of numbers that are normally distributed.
See also
 In Spanish: Distribución normal multivariada para niños
