Econometrics facts for kids
Econometrics is a special part of economics. It uses statistics and math to understand how different economic things are connected. Think of things like capital (tools or resources used to make stuff), interest rates (the cost of borrowing money), and labor (people's work).
Econometrics helps us make simple "pictures" of the real world, called models. These models are like simplified maps that show how economic things work together. Once we have a model, we can use it to guess what might happen in the future.
Contents
What is Econometrics?
Econometrics is like being a detective for the economy. It helps economists figure out the relationships between different economic forces. For example, it can help us understand how much people spend when their income changes, or how interest rates affect how many houses people buy.
Why Do We Use Models?
Imagine you want to predict how many ice creams will be sold next summer. You could look at past sales, the weather, and the price of ice cream. An econometric model would take all this information and create a simple rule or equation. This rule can then help you guess how many ice creams might sell if the weather is hot or if prices change. These models help us make smart decisions.
Econometrics in Action: House Prices
Let's look at an example with house prices in a town. An economist (someone who studies economics) might notice that houses closer to the main market usually cost more. They could create a model that shows this connection.
If a new market is built in another part of town, the economist could use their model to predict what might happen. They might guess that house prices near the new market will go up. They might also predict that prices near the old market could go down a bit. This is because more houses would now be "near a market," meaning more sellers might compete, which can lower prices.
How Econometricians Work: Linear Regression
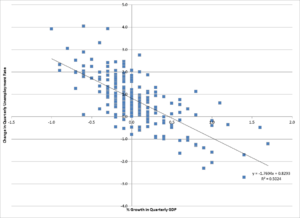
One of the most important tools in econometrics is called linear regression. It's like drawing a straight line through a bunch of dots on a graph. Each dot could represent, for example, a house's size and its price.
Imagine you have data points for many houses, showing their size and their price. Linear regression helps you find the "best fit" straight line that goes through these points. This line then helps you predict the price of a house based on its size, even if you haven't seen that exact size before. It's a simple but powerful way to see relationships between two or more things. While there are many other advanced tools, linear regression is often the first step for economists to understand data.
See also
 In Spanish: Econometría para niños
 | May Edward Chinn |
 | Rebecca Cole |
 | Alexa Canady |
 | Dorothy Lavinia Brown |


