
Ordinary least squares facts for kids

Ordinary Least Squares (often called OLS) is a smart way to find the "best fit" line through a bunch of data points. Imagine you have a scatter plot with many dots, and you want to draw a straight line that comes as close as possible to all of them. OLS helps you do just that!
It's a very common method used in linear regression, which is a type of statistics. The main goal of OLS is to make the differences between your actual data points and the points on your new line as small as possible. When these differences are small, it means your line is a really good guess or "model" for the data.
OLS is a special kind of a bigger idea called least squares. It's super useful because it gives you a simple formula to figure out where your "best fit" line should go.
Contents
What is Ordinary Least Squares?
Ordinary Least Squares is a powerful tool that helps us understand how different things are connected. For example, it can help us see if there's a relationship between how much someone studies and their test scores, or between the amount of rain and how many plants grow.
Finding the "Best Fit" Line
Think of it like this: you have a graph with many dots scattered around. Each dot might show, for example, a student's study time and their test score. You want to draw a straight line that shows the general trend of these dots. This line helps you predict what might happen next.
OLS finds the line that has the smallest total "error." The "error" is the distance from each dot to the line. If a dot is far from the line, that's a big error. OLS tries to make all these errors as tiny as possible.
Why "Least Squares"?
The "squares" part of the name is important. When OLS calculates the distance from each dot to the line, it squares that distance. Why? Because some dots will be above the line (positive distance) and some will be below (negative distance). If you just added them up, positive and negative numbers could cancel each other out, making it seem like the line is perfect when it's not.
By squaring the distances, all the numbers become positive. This way, OLS truly minimizes the total amount of "wrongness" or difference between your line and the actual data. It finds the line where the sum of these squared differences is the smallest possible.
How OLS Helps Us Understand Data
OLS is used in many different areas to make predictions and understand relationships.
Predicting Trends
Imagine you're tracking how much ice cream is sold each day based on the temperature. You could plot daily sales against daily temperatures. Using OLS, you could draw a line that shows how ice cream sales generally go up as the temperature rises. This line could then help you predict how much ice cream you might sell on a hot day next week.
Understanding Relationships
Scientists and economists use OLS to understand how different factors influence each other. For instance, they might use it to see if there's a clear link between the amount of fertilizer used and how much food a farm produces. OLS helps them find patterns and make sense of complex information.
Where is OLS Used?
Ordinary Least Squares is a fundamental method in many fields.
- Economics: Economists use it to study things like how changes in interest rates affect prices or how unemployment relates to economic growth. The image at the top of this article shows an example with Okun's law, which links GDP growth to unemployment rates.
- Science: In fields like biology or physics, OLS can help analyze experimental data. For example, it might be used to see how a plant's growth changes with different amounts of light.
- Business: Businesses use OLS to predict sales, understand customer behavior, or forecast future trends.
Images for kids
-
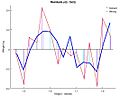
This graph shows the "residuals" (the differences between the actual data points and the line found by OLS). Smaller residuals mean a better fit!

See also
 In Spanish: Mínimos cuadrados ordinarios para niños
