María La Baja facts for kids
Quick facts for kids
María La Baja
|
||
|---|---|---|
|
Municipality and town
|
||
|
||

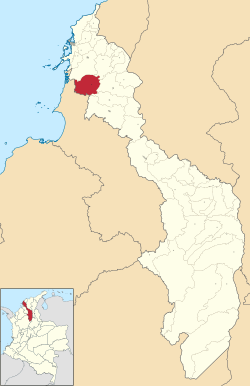
Location of the municipality and town of María La Baja in the Bolívar Department of Colombia
|
||
| Country | ||
| Department | Bolívar Department | |
| Area | ||
| • Municipality and town | 559.9 km2 (216.2 sq mi) | |
| • Urban | 2.91 km2 (1.12 sq mi) | |
| Elevation | 14 m (46 ft) | |
| Population
(2018 census)
|
||
| • Municipality and town | 46,112 | |
| • Urban | 20,451 | |
| • Urban density | 7,028/km2 (18,200/sq mi) | |
| Time zone | UTC-5 (Colombia Standard Time) | |
María La Baja is a town and municipality in northern Colombia. It is part of the Bolívar Department.
History of María La Baja
María La Baja was founded a long time ago. A person named Alonso de Heredia started the town. This happened on December 8, 1535.
Geography and Climate
María La Baja is a large area. It covers about 547 square kilometers. The municipality shares borders with several other towns. To the north is Arjona. To the east are Mahates and San Juan Nepomuceno. South of it are El Carmen de Bolívar and San Jacinto. To the west, it borders San Onofre in the Sucre Department.
The main town of María La Baja is smaller. It is about 150 square kilometers. The town is located about 72 kilometers from Cartagena. Cartagena is the capital city of the Bolívar Department.
The weather in María La Baja is warm all year. The average temperature is around 28 degrees Celsius.
| Climate data for María La Baja (Nueva Florida), elevation 13 m (43 ft), (1981–2010) | |||||||||||||
|---|---|---|---|---|---|---|---|---|---|---|---|---|---|
| Month | Jan | Feb | Mar | Apr | May | Jun | Jul | Aug | Sep | Oct | Nov | Dec | Year |
| Mean daily maximum °C (°F) | 33.9 (93.0) |
34.1 (93.4) |
34.2 (93.6) |
33.8 (92.8) |
32.8 (91.0) |
32.8 (91.0) |
33.0 (91.4) |
33.0 (91.4) |
32.4 (90.3) |
32.0 (89.6) |
32.1 (89.8) |
32.8 (91.0) |
33.1 (91.6) |
| Daily mean °C (°F) | 26.8 (80.2) |
27.3 (81.1) |
27.5 (81.5) |
27.7 (81.9) |
27.7 (81.9) |
27.6 (81.7) |
27.5 (81.5) |
27.3 (81.1) |
26.9 (80.4) |
26.7 (80.1) |
26.8 (80.2) |
26.7 (80.1) |
27.2 (81.0) |
| Mean daily minimum °C (°F) | 20.8 (69.4) |
21.4 (70.5) |
22.2 (72.0) |
23.3 (73.9) |
23.8 (74.8) |
23.4 (74.1) |
23.0 (73.4) |
22.9 (73.2) |
22.7 (72.9) |
22.7 (72.9) |
22.9 (73.2) |
21.7 (71.1) |
22.6 (72.7) |
| Average precipitation mm (inches) | 19.3 (0.76) |
28.9 (1.14) |
41.6 (1.64) |
126.0 (4.96) |
180.0 (7.09) |
186.5 (7.34) |
194.1 (7.64) |
197.7 (7.78) |
186.1 (7.33) |
191.8 (7.55) |
179.5 (7.07) |
74.2 (2.92) |
1,542.6 (60.73) |
| Average precipitation days (≥ 1.0 mm) | 2 | 3 | 4 | 10 | 12 | 13 | 14 | 14 | 13 | 14 | 13 | 6 | 112 |
| Average relative humidity (%) | 83 | 82 | 80 | 83 | 85 | 85 | 85 | 85 | 87 | 87 | 86 | 85 | 84 |
| Mean monthly sunshine hours | 248.0 | 203.3 | 189.1 | 159.0 | 139.5 | 141.0 | 167.4 | 158.1 | 126.0 | 130.2 | 147.0 | 210.8 | 2,019.4 |
| Mean daily sunshine hours | 8.0 | 7.2 | 6.1 | 5.3 | 4.5 | 4.7 | 5.4 | 5.1 | 4.2 | 4.2 | 4.9 | 6.8 | 5.5 |
| Source: Instituto de Hidrologia Meteorologia y Estudios Ambientales | |||||||||||||
| Climate data for María La Baja (San Pablo), elevation 20 m (66 ft), (1981–2010) | |||||||||||||
|---|---|---|---|---|---|---|---|---|---|---|---|---|---|
| Month | Jan | Feb | Mar | Apr | May | Jun | Jul | Aug | Sep | Oct | Nov | Dec | Year |
| Mean daily maximum °C (°F) | 34.0 (93.2) |
34.5 (94.1) |
34.4 (93.9) |
34.5 (94.1) |
32.9 (91.2) |
33.0 (91.4) |
33.1 (91.6) |
33.1 (91.6) |
32.7 (90.9) |
32.0 (89.6) |
32.2 (90.0) |
33.0 (91.4) |
33.3 (91.9) |
| Daily mean °C (°F) | 27.3 (81.1) |
27.9 (82.2) |
28.2 (82.8) |
28.2 (82.8) |
27.8 (82.0) |
27.9 (82.2) |
27.8 (82.0) |
27.8 (82.0) |
27.4 (81.3) |
27.0 (80.6) |
27.1 (80.8) |
27.1 (80.8) |
27.6 (81.7) |
| Mean daily minimum °C (°F) | 21.6 (70.9) |
22.2 (72.0) |
23.0 (73.4) |
23.8 (74.8) |
23.9 (75.0) |
23.8 (74.8) |
23.5 (74.3) |
23.4 (74.1) |
23.5 (74.3) |
23.3 (73.9) |
23.2 (73.8) |
22.3 (72.1) |
23.1 (73.6) |
| Average precipitation mm (inches) | 18.6 (0.73) |
23.4 (0.92) |
49.0 (1.93) |
124.8 (4.91) |
190.6 (7.50) |
183.8 (7.24) |
184.0 (7.24) |
230.3 (9.07) |
215.5 (8.48) |
237.8 (9.36) |
173.9 (6.85) |
93.5 (3.68) |
1,725.4 (67.93) |
| Average precipitation days (≥ 1.0 mm) | 2 | 3 | 4 | 11 | 16 | 16 | 15 | 17 | 16 | 17 | 15 | 8 | 133 |
| Average relative humidity (%) | 79 | 75 | 75 | 78 | 83 | 82 | 81 | 83 | 84 | 85 | 85 | 82 | 81 |
| Mean monthly sunshine hours | 257.3 | 220.2 | 201.5 | 174.0 | 151.9 | 165.0 | 189.1 | 179.8 | 141.0 | 145.7 | 162.0 | 223.2 | 2,210.7 |
| Mean daily sunshine hours | 8.3 | 7.8 | 6.5 | 5.8 | 4.9 | 5.5 | 6.1 | 5.8 | 4.7 | 4.7 | 5.4 | 7.2 | 6.1 |
| Source: Instituto de Hidrologia Meteorologia y Estudios Ambientales | |||||||||||||
Safety and Community Growth
In recent years, María La Baja has grown a lot. About 7,000 people have moved to the town. They came from the areas around the town. This happened because of problems in the countryside.
Some armed groups were active in the nearby hills. These groups caused trouble for people living there. Because of this, many families moved to the town for safety.
The good news is that the situation has gotten much better. One of the armed groups gave up their weapons in 2005. This was part of a plan by the government to make the country safer. Now, the security in María La Baja has improved. Marines have even set up a base near the town. This helps keep everyone safe.
See also
 In Spanish: María La Baja para niños
 | Charles R. Drew |
 | Benjamin Banneker |
 | Jane C. Wright |
 | Roger Arliner Young |


