Mariquita, Tolima facts for kids
Quick facts for kids
Mariquita, Tolima
|
|||
|---|---|---|---|
|
Municipality and town
|
|||
|
|||

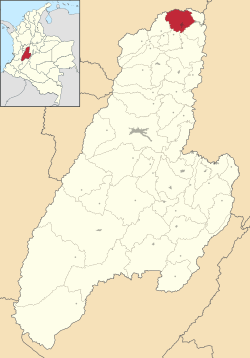
Location of the municipality and town of Mariquita, Tolima in the Tolima Department of Colombia.
|
|||
| Country | |||
| Department | Tolima Department | ||
| Area | |||
| • Municipality and town | 293.3 km2 (113.2 sq mi) | ||
| • Urban | 5.91 km2 (2.28 sq mi) | ||
| Elevation | 495 m (1,624 ft) | ||
| Population
(2018 census)
|
|||
| • Municipality and town | 37,770 | ||
| • Density | 128.78/km2 (333.53/sq mi) | ||
| • Urban | 27,907 | ||
| • Urban density | 4,722/km2 (12,230/sq mi) | ||
| Time zone | UTC-5 (Colombia Standard Time) | ||
San Sebastián de Mariquita is a town and municipality in the Tolima department of Colombia. It is about 150 kilometers (93 miles) northwest of Bogotá, the capital city.
This area was important for early Spanish settlements because it was close to the Magdalena River. Today, Mariquita is a popular spot for tourists from Bogotá. They visit places like the Medina Waterfalls (Cataratas de Medina) and the old mint (Casa de la Moneda).
A famous Spanish explorer named Gonzalo Jiménez de Quesada died here. He is buried in the Primatial Cathedral of Bogotá. Mariquita now has many large hotels and traditional country estates called haciendas, such as Villa de los Caballeros. In 2018, the municipality had a population of 37,770 people.
Mariquita's Climate and Weather
Mariquita has a warm climate typical of its location. The weather is generally consistent throughout the year. It has high temperatures and a lot of rain.
Temperature in Mariquita
The average temperature in Mariquita is around 25 degrees Celsius (77 degrees Fahrenheit). The hottest months are usually July and August. The coolest months are November and December.
Rainfall and Humidity
Mariquita receives a lot of rain, especially from October to December. The wettest month is October. The driest months are July and August. The air is often humid, meaning there is a lot of moisture in the air.
| Climate data for Mariquita (Albania), elevation 500 m (1,600 ft), (1981–2010) | |||||||||||||
|---|---|---|---|---|---|---|---|---|---|---|---|---|---|
| Month | Jan | Feb | Mar | Apr | May | Jun | Jul | Aug | Sep | Oct | Nov | Dec | Year |
| Mean daily maximum °C (°F) | 28.3 (82.9) |
28.7 (83.7) |
28.4 (83.1) |
28.4 (83.1) |
28.3 (82.9) |
28.8 (83.8) |
29.5 (85.1) |
30.1 (86.2) |
29.2 (84.6) |
28.2 (82.8) |
27.7 (81.9) |
27.8 (82.0) |
28.6 (83.5) |
| Daily mean °C (°F) | 24.9 (76.8) |
25.0 (77.0) |
24.8 (76.6) |
24.9 (76.8) |
24.9 (76.8) |
25.3 (77.5) |
25.5 (77.9) |
25.8 (78.4) |
25.2 (77.4) |
24.6 (76.3) |
24.5 (76.1) |
24.5 (76.1) |
25.0 (77.0) |
| Mean daily minimum °C (°F) | 20.2 (68.4) |
20.3 (68.5) |
20.1 (68.2) |
20.3 (68.5) |
20.4 (68.7) |
20.6 (69.1) |
20.4 (68.7) |
20.3 (68.5) |
20.1 (68.2) |
20.1 (68.2) |
20.2 (68.4) |
20.3 (68.5) |
20.3 (68.5) |
| Average precipitation mm (inches) | 218.7 (8.61) |
182.2 (7.17) |
302.6 (11.91) |
383.1 (15.08) |
332.6 (13.09) |
141.3 (5.56) |
116.5 (4.59) |
192.3 (7.57) |
258.2 (10.17) |
489.6 (19.28) |
503.5 (19.82) |
372.8 (14.68) |
3,493.5 (137.54) |
| Average precipitation days | 14 | 13 | 17 | 18 | 18 | 12 | 10 | 12 | 17 | 22 | 21 | 19 | 189 |
| Average relative humidity (%) | 79 | 76 | 78 | 79 | 79 | 75 | 72 | 70 | 74 | 79 | 80 | 80 | 77 |
| Mean monthly sunshine hours | 176.7 | 152.4 | 139.5 | 147.0 | 158.1 | 174.0 | 195.3 | 198.4 | 174.0 | 170.5 | 150.0 | 158.1 | 1,994 |
| Mean daily sunshine hours | 5.7 | 5.4 | 4.5 | 4.9 | 5.1 | 5.8 | 6.3 | 6.4 | 5.8 | 5.5 | 5.0 | 5.1 | 5.5 |
| Source: Instituto de Hidrologia Meteorologia y Estudios Ambientales | |||||||||||||
See also
 In Spanish: Mariquita (Tolima) para niños


