Mount Read facts for kids
Quick facts for kids Mount Read |
|
|---|---|
| Highest point | |
| Elevation | 1,123 m (3,684 ft) |
| Geography | |
| Location | West Coast, Tasmania, Australia |
| Parent range | West Coast Range |
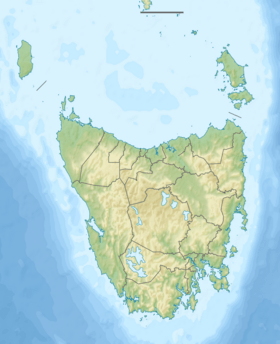
Mount Read is a mountain in Tasmania, Australia. It's on the western side of the island, part of the West Coast Range.
It stands tall at 1,123 metres (3,684 ft) above sea level. For over a hundred years, Mount Read has been a busy place. People have mined for valuable minerals and even built small towns on its slopes.
Contents
Exploring Mount Read's Geology
Mount Read is special because of its geology. The rocks here, called the Mount Read Volcanics, hold important deposits of copper and gold.
Even after the first mines closed, more mineral deposits were found. This shows how rich the area is in valuable metals.
South-east of Mount Read, you can see signs of ancient glaciers. There are also beautiful lakes formed by glaciers, like Lake Westwood, Lake Selina, and Lake Julia.
The Hercules Mine and Haulage System
The Hercules Mine on Mount Read was a big mining operation. It was connected to a town called Williamsford by a special transport system. This system was a 1,642-foot (500 m) long incline called a haulage.
The haulage moved materials up and down the mountain. It was 1-mile (1.6 km) long and very steep in places. The mine was active in the late 1800s and continued producing minerals until the mid-1900s.
The Hercules Gold and Silver Mining Company operated the mine for a while. Later, another company, Mount Read and Rosebery Mines Limited, took over.
Life in Mount Read Township
A small community grew around the Hercules mine. This settlement was known as the Mount Read township. People living there faced challenges getting services and facilities.
It was a unique place because of its high location. "Situated at 1000 metres Mount Read (township) was the most elevated town which has existed in Tasmania."
Amazing Huon Pine Forests
Even with all the mining, Mount Read is home to special forests. Its slopes have unique and important stands of Huon pine trees.
The southern part of Mount Read is a protected area. It's called the Lake Johnston Nature Reserve. This reserve helps protect the special habitat of the Huon pine.
Mount Read's Weather and Climate
Mount Read has a cool, wet climate. It's similar to an alpine climate, with cold temperatures and lots of rain.
There's a weather station on Mount Read. It records extreme weather, especially heavy rainfall. It has one of the highest numbers of rainy days in the world, with about 282 days of rain each year.
This is more than places like Cherrapunji in India. However, it gets less rain than Mount Waialeale in Hawaii. Snow often falls on Mount Read, sometimes very heavily. It can snow at any time of the year.
The air on Mount Read is very humid, especially in cooler months. This makes it one of the most humid places in Australia.
| Climate data for Mount Read (1996–2022); 1,120 m AMSL; 41.84° S, 145.54° E | |||||||||||||
|---|---|---|---|---|---|---|---|---|---|---|---|---|---|
| Month | Jan | Feb | Mar | Apr | May | Jun | Jul | Aug | Sep | Oct | Nov | Dec | Year |
| Record high °C (°F) | 30.4 (86.7) |
29.5 (85.1) |
27.9 (82.2) |
20.6 (69.1) |
15.3 (59.5) |
11.4 (52.5) |
10.0 (50.0) |
12.5 (54.5) |
16.2 (61.2) |
22.6 (72.7) |
24.5 (76.1) |
27.6 (81.7) |
30.4 (86.7) |
| Mean daily maximum °C (°F) | 14.4 (57.9) |
14.2 (57.6) |
12.0 (53.6) |
8.9 (48.0) |
6.4 (43.5) |
4.7 (40.5) |
3.7 (38.7) |
3.9 (39.0) |
5.6 (42.1) |
7.8 (46.0) |
10.8 (51.4) |
12.1 (53.8) |
8.7 (47.7) |
| Daily mean °C (°F) | 10.1 (50.2) |
10.2 (50.4) |
8.6 (47.5) |
6.2 (43.2) |
4.3 (39.7) |
2.9 (37.2) |
2.0 (35.6) |
2.0 (35.6) |
3.0 (37.4) |
4.6 (40.3) |
7.0 (44.6) |
8.1 (46.6) |
5.8 (42.4) |
| Mean daily minimum °C (°F) | 5.8 (42.4) |
6.2 (43.2) |
5.1 (41.2) |
3.4 (38.1) |
2.2 (36.0) |
1.0 (33.8) |
0.2 (32.4) |
−0.1 (31.8) |
0.4 (32.7) |
1.4 (34.5) |
3.2 (37.8) |
4.1 (39.4) |
2.7 (36.9) |
| Record low °C (°F) | −1.2 (29.8) |
−0.8 (30.6) |
−4.7 (23.5) |
−4.5 (23.9) |
−3.9 (25.0) |
−5.2 (22.6) |
−5.0 (23.0) |
−5.5 (22.1) |
−5.1 (22.8) |
−5.0 (23.0) |
−4.5 (23.9) |
−2.3 (27.9) |
−5.5 (22.1) |
| Average precipitation mm (inches) | 201.1 (7.92) |
174.4 (6.87) |
264.2 (10.40) |
283.7 (11.17) |
397.4 (15.65) |
341.1 (13.43) |
391.5 (15.41) |
336.3 (13.24) |
377.1 (14.85) |
397.6 (15.65) |
220.4 (8.68) |
292.2 (11.50) |
3,628.1 (142.84) |
| Average precipitation days (≥ 0.2 mm) | 19.1 | 17.4 | 22.5 | 24.0 | 26.7 | 25.9 | 26.6 | 25.6 | 25.8 | 25.9 | 21.2 | 21.7 | 282.4 |
| Average afternoon relative humidity (%) | 76 | 75 | 84 | 88 | 94 | 92 | 95 | 93 | 91 | 84 | 77 | 80 | 86 |
| Source: Bureau of Meteorology | |||||||||||||


