Murphy Hot Springs, Idaho facts for kids
Quick facts for kids
Murphy Hot Springs, Idaho
|
|
|---|---|

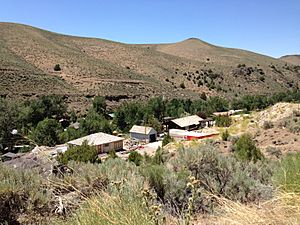
Murphy Hot Springs, June 2013
|
|
| Country | United States |
| State | Idaho |
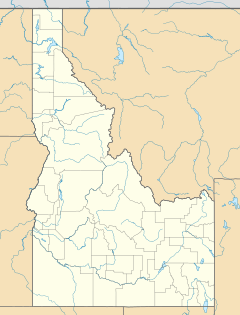
| County | Owyhee |
| Time zone | UTC-7 (Mountain (MST)) |
| • Summer (DST) | UTC-6 (MDT) |
Murphy Hot Springs is a small community located in Owyhee County, Idaho, in the United States. It is known as an unincorporated community, which means it doesn't have its own local government like a city or town. Instead, it's managed by the county it's in.
About Murphy Hot Springs
This community is nestled in a beautiful canyon, right by the East Fork Jarbidge River. You can find it along Three Creek Road, between two towns: Rogerson in Idaho and Jarbidge in Nevada. Back in 2007, about 50 homes were part of this quiet community.
Weather and Climate
Murphy Hot Springs experiences a wide range of weather. It can get very hot in the summer, with the highest temperature ever recorded being 102°F (39°C) on July 15, 2014. Winters can be very cold, with the lowest temperature recorded at -27°F (-33°C) on February 2, 1996.
The area gets a good amount of rain and snow throughout the year. April and May usually see the most rainfall. Snowfall is common in the winter months, especially from December to March.
| Climate data for Murphy Hot Springs, Idaho, 1991–2020 normals, extremes 1987–present | |||||||||||||
|---|---|---|---|---|---|---|---|---|---|---|---|---|---|
| Month | Jan | Feb | Mar | Apr | May | Jun | Jul | Aug | Sep | Oct | Nov | Dec | Year |
| Record high °F (°C) | 65 (18) |
65 (18) |
75 (24) |
86 (30) |
91 (33) |
99 (37) |
102 (39) |
99 (37) |
98 (37) |
91 (33) |
77 (25) |
70 (21) |
102 (39) |
| Mean maximum °F (°C) | 56.7 (13.7) |
59.4 (15.2) |
66.1 (18.9) |
76.2 (24.6) |
82.9 (28.3) |
91.6 (33.1) |
96.7 (35.9) |
95.4 (35.2) |
91.0 (32.8) |
81.0 (27.2) |
68.3 (20.2) |
58.5 (14.7) |
97.4 (36.3) |
| Mean daily maximum °F (°C) | 40.7 (4.8) |
42.7 (5.9) |
49.6 (9.8) |
55.3 (12.9) |
65.4 (18.6) |
75.2 (24.0) |
86.3 (30.2) |
85.0 (29.4) |
76.5 (24.7) |
62.3 (16.8) |
48.5 (9.2) |
39.9 (4.4) |
60.6 (15.9) |
| Daily mean °F (°C) | 29.1 (−1.6) |
30.7 (−0.7) |
36.8 (2.7) |
41.5 (5.3) |
49.9 (9.9) |
57.4 (14.1) |
66.2 (19.0) |
65.1 (18.4) |
56.9 (13.8) |
45.6 (7.6) |
35.2 (1.8) |
27.8 (−2.3) |
45.2 (7.3) |
| Mean daily minimum °F (°C) | 17.5 (−8.1) |
18.8 (−7.3) |
24.1 (−4.4) |
27.6 (−2.4) |
34.5 (1.4) |
39.6 (4.2) |
46.2 (7.9) |
45.1 (7.3) |
37.4 (3.0) |
28.9 (−1.7) |
21.9 (−5.6) |
15.7 (−9.1) |
29.8 (−1.2) |
| Mean minimum °F (°C) | −0.4 (−18.0) |
2.7 (−16.3) |
12.2 (−11.0) |
17.2 (−8.2) |
23.7 (−4.6) |
30.9 (−0.6) |
37.9 (3.3) |
35.4 (1.9) |
28.0 (−2.2) |
17.1 (−8.3) |
5.6 (−14.7) |
−0.3 (−17.9) |
−6.3 (−21.3) |
| Record low °F (°C) | −17 (−27) |
−27 (−33) |
2 (−17) |
11 (−12) |
18 (−8) |
18 (−8) |
21 (−6) |
23 (−5) |
24 (−4) |
−2 (−19) |
−6 (−21) |
−23 (−31) |
−27 (−33) |
| Average precipitation inches (mm) | 1.12 (28) |
0.95 (24) |
1.16 (29) |
2.24 (57) |
2.29 (58) |
1.21 (31) |
0.72 (18) |
0.54 (14) |
0.88 (22) |
1.00 (25) |
1.31 (33) |
1.29 (33) |
14.71 (372) |
| Average snowfall inches (cm) | 6.5 (17) |
10.2 (26) |
8.3 (21) |
4.1 (10) |
0.6 (1.5) |
0.0 (0.0) |
0.0 (0.0) |
0.0 (0.0) |
0.0 (0.0) |
0.5 (1.3) |
7.2 (18) |
9.9 (25) |
47.3 (119.8) |
| Average precipitation days (≥ 0.01 in) | 7.7 | 7.8 | 9.8 | 11.3 | 11.0 | 6.2 | 4.6 | 5.0 | 4.9 | 6.6 | 8.5 | 8.4 | 91.8 |
| Average snowy days (≥ 0.1 in) | 4.1 | 4.8 | 4.4 | 1.8 | 0.3 | 0.1 | 0.0 | 0.0 | 0.0 | 0.7 | 3.5 | 5.5 | 25.2 |
| Source 1: NOAA | |||||||||||||
| Source 2: National Weather Service | |||||||||||||


