New Lebanon, Pennsylvania facts for kids
Quick facts for kids
New Lebanon, Pennsylvania
|
|
|---|---|
|
Borough
|
|

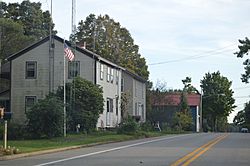
Houses on Mercer Street
|
|

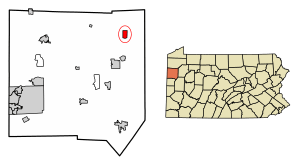
Location of New Lebanon in Mercer County, Pennsylvania.
|
|
| Country | United States |
| State | Pennsylvania |
| County | Mercer |
| Established | 1866 |
| Area | |
| • Total | 1.28 sq mi (3.31 km2) |
| • Land | 1.27 sq mi (3.30 km2) |
| • Water | 0.01 sq mi (0.01 km2) |
| Highest elevation
(center of borough)
|
1,400 ft (400 m) |
| Lowest elevation
(Mill Creek)
|
1,280 ft (390 m) |
| Population
(2020)
|
|
| • Total | 183 |
| • Density | 143.75/sq mi (55.51/km2) |
| Time zone | UTC-4 (EST) |
| • Summer (DST) | UTC-5 (EDT) |
| Area code(s) | 724 |
New Lebanon is a small town in the northeastern part of Mercer County, Pennsylvania, in the United States. In 2020, about 186 people lived there. It is part of the larger Hermitage area.
Contents
Where is New Lebanon?
New Lebanon is located at 41.414819 degrees north latitude and -80.074612 degrees west longitude. This means it's in the northern part of the world, west of the Prime Meridian.
The United States Census Bureau says the town covers about 1.3 square miles (3.3 square kilometers). Most of this area is land. Only a tiny part, less than 1%, is water.
How Many People Live Here?
| Historical population | |||
|---|---|---|---|
| Census | Pop. | %± | |
| 1870 | 273 | — | |
| 1880 | 279 | 2.2% | |
| 1890 | 263 | −5.7% | |
| 1900 | 185 | −29.7% | |
| 1910 | 164 | −11.4% | |
| 1920 | 118 | −28.0% | |
| 1930 | 140 | 18.6% | |
| 1940 | 154 | 10.0% | |
| 1950 | 179 | 16.2% | |
| 1960 | 166 | −7.3% | |
| 1970 | 211 | 27.1% | |
| 1980 | 197 | −6.6% | |
| 1990 | 209 | 6.1% | |
| 2000 | 205 | −1.9% | |
| 2010 | 188 | −8.3% | |
| 2020 | 186 | −1.1% | |
| 2021 (est.) | 184 | −2.1% | |
| Sources: | |||
In the year 2000, there were 205 people living in New Lebanon. These people lived in 78 different homes. Most of these homes (58) were families.
The population density was about 160 people per square mile (62 people per square kilometer). This means there were 160 people for every square mile of land.
Most people in New Lebanon were White (99.51%). A small number (0.49%) were from two or more racial backgrounds.
Families and Households
Out of the 78 homes, about 34.6% had children under 18 living there. Most homes (61.5%) were married couples living together. About 10.3% of homes had a female head of household with no husband.
About 17.9% of all homes were single people living alone. Some of these were people aged 65 or older (9.0%). On average, there were 2.63 people in each home and 3.00 people in each family.
Age Groups
The people in New Lebanon were spread out across different age groups:
- 25.9% were under 18 years old.
- 9.8% were between 18 and 24 years old.
- 26.8% were between 25 and 44 years old.
- 24.9% were between 45 and 64 years old.
- 12.7% were 65 years old or older.
The average age of people in New Lebanon was 36 years. For every 100 females, there were about 88.1 males. For every 100 females aged 18 and over, there were about 92.4 males.
Income Information
In 2000, the average income for a household in New Lebanon was $38,472 per year. For families, the average income was $38,750 per year.
Males earned about $34,167 per year on average, while females earned about $17,750 per year. The average income per person in the town was $16,735.
About 10.0% of families and 12.6% of all people lived below the poverty line. This included 16.7% of those under 18 and 21.7% of those 65 or older.
See also
 In Spanish: New Lebanon (Pensilvania) para niños
 | Bayard Rustin |
 | Jeannette Carter |
 | Jeremiah A. Brown |

