Oilmont, Montana facts for kids
Quick facts for kids
Oilmont, Montana
|
|
|---|---|
| Country | United States |
| State | Montana |
| County | Toole |
| Elevation | 3,501 ft (1,067 m) |
| Time zone | UTC-7 (Mountain (MST)) |
| • Summer (DST) | UTC-6 (MDT) |
| ZIP code |
59466
|
| Area code(s) | 406 |
| GNIS feature ID | 774918 |
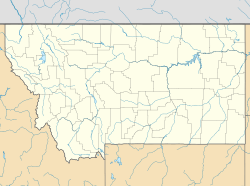
Oilmont is a place in Montana, USA, that used to be a small community but is now mostly empty. People left Oilmont because chemicals from oil drilling made the local water unsafe to drink. It is located in Toole County, Montana.
About Oilmont
Oilmont was once a small community in Toole County, Montana. It was an unincorporated community, which means it did not have its own local government like a city or town. Instead, it was governed by the county.
You can find Oilmont near Interstate 15, a major highway in Montana. People could get to Oilmont from Exit 379 on the highway.
Why Oilmont Was Abandoned
The community of Oilmont became empty because of a serious environmental problem. Chemicals used in the process of getting oil out of the ground got into the local water. This made the water unsafe to drink. Because the water was contaminated, people could no longer live there safely, and so they moved away.
Important Buildings
Even though Oilmont is mostly abandoned, it is still home to Bethany Lutheran Church. This church is special because it is listed on the National Register of Historic Places. This means it is recognized as an important historical site in the United States.
There was also a place called the Absure Refinery nearby. A refinery is a factory that takes raw materials and makes them into useful products. The Absure Refinery processed petroleum (crude oil) that came from the Kevin Sunburst Oil Field in the area.
Weather in Oilmont
The weather in the Oilmont area is measured by a nearby weather station called Dunkirk 19NNE. This station is about 16 miles (25.7 km) west of Oilmont.
The climate here is known as a cold semi-arid climate. This means it is generally dry, but not as dry as a desert. It also has cold winters.
The weather box below shows more details about the temperatures and rainfall in the area over many years.
| Climate data for Dunkirk 19NNE, Montana, 1991–2020 normals, 1922-2020 extremes: 3323ft (1013m) | |||||||||||||
|---|---|---|---|---|---|---|---|---|---|---|---|---|---|
| Month | Jan | Feb | Mar | Apr | May | Jun | Jul | Aug | Sep | Oct | Nov | Dec | Year |
| Record high °F (°C) | 63 (17) |
69 (21) |
79 (26) |
89 (32) |
94 (34) |
102 (39) |
105 (41) |
108 (42) |
98 (37) |
90 (32) |
74 (23) |
68 (20) |
108 (42) |
| Mean maximum °F (°C) | 52.9 (11.6) |
52.6 (11.4) |
63.1 (17.3) |
75.8 (24.3) |
83.6 (28.7) |
89.1 (31.7) |
96.2 (35.7) |
95.2 (35.1) |
89.6 (32.0) |
78.2 (25.7) |
63.6 (17.6) |
52.2 (11.2) |
97.6 (36.4) |
| Mean daily maximum °F (°C) | 29.4 (−1.4) |
33.6 (0.9) |
43.0 (6.1) |
55.0 (12.8) |
65.1 (18.4) |
72.3 (22.4) |
81.9 (27.7) |
81.3 (27.4) |
70.4 (21.3) |
56.5 (13.6) |
41.4 (5.2) |
32.1 (0.1) |
55.2 (12.9) |
| Daily mean °F (°C) | 16.9 (−8.4) |
20.2 (−6.6) |
29.8 (−1.2) |
41.1 (5.1) |
51.2 (10.7) |
58.7 (14.8) |
65.9 (18.8) |
64.9 (18.3) |
54.6 (12.6) |
41.3 (5.2) |
28.2 (−2.1) |
18.9 (−7.3) |
41.0 (5.0) |
| Mean daily minimum °F (°C) | 4.5 (−15.3) |
6.8 (−14.0) |
16.6 (−8.6) |
27.1 (−2.7) |
37.4 (3.0) |
45.1 (7.3) |
49.9 (9.9) |
48.5 (9.2) |
38.8 (3.8) |
26.1 (−3.3) |
14.9 (−9.5) |
5.8 (−14.6) |
26.8 (−2.9) |
| Mean minimum °F (°C) | −24.3 (−31.3) |
−17.9 (−27.7) |
−7.3 (−21.8) |
10.3 (−12.1) |
21.5 (−5.8) |
33.9 (1.1) |
37.8 (3.2) |
35.8 (2.1) |
26.4 (−3.1) |
6.7 (−14.1) |
−8.4 (−22.4) |
−19.2 (−28.4) |
−31.3 (−35.2) |
| Record low °F (°C) | −46 (−43) |
−42 (−41) |
−34 (−37) |
−17 (−27) |
7 (−14) |
22 (−6) |
31 (−1) |
29 (−2) |
2 (−17) |
−15 (−26) |
−33 (−36) |
−40 (−40) |
−46 (−43) |
| Average precipitation inches (mm) | 0.33 (8.4) |
0.28 (7.1) |
0.42 (11) |
0.99 (25) |
1.67 (42) |
2.61 (66) |
1.10 (28) |
0.88 (22) |
1.05 (27) |
0.58 (15) |
0.44 (11) |
0.29 (7.4) |
10.64 (269.9) |
| Average snowfall inches (cm) | 5.0 (13) |
5.2 (13) |
4.9 (12) |
3.7 (9.4) |
0.5 (1.3) |
0.1 (0.25) |
0.0 (0.0) |
0.0 (0.0) |
0.3 (0.76) |
2.2 (5.6) |
4.5 (11) |
5.5 (14) |
31.9 (80.31) |
| Source 1: NOAA | |||||||||||||
| Source 2: XMACIS (2002-2020 snowfall, temp records & monthly max/mins) | |||||||||||||
 | Victor J. Glover |
 | Yvonne Cagle |
 | Jeanette Epps |
 | Bernard A. Harris Jr. |


