Olney, Montana facts for kids
Quick facts for kids
Olney, Montana
|
|
|---|---|
| Country | United States |
| State | Montana |
| County | Flathead |
| Area | |
| • Total | 1.34 sq mi (3.48 km2) |
| • Land | 1.33 sq mi (3.44 km2) |
| • Water | 0.01 sq mi (0.04 km2) |
| Elevation | 3,169 ft (966 m) |
| Population
(2020)
|
|
| • Total | 186 |
| • Density | 139.85/sq mi (53.99/km2) |
| Time zone | UTC-7 (Mountain (MST)) |
| • Summer (DST) | UTC-6 (MDT) |
| ZIP code |
59927
|
| Area code(s) | 406 |
| GNIS feature ID | 788442 |
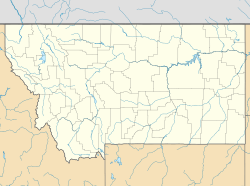
Olney is a small community in Flathead County, Montana, in the United States. It is known as a "census-designated place" because the government tracks its population. However, it does not have its own local government like a city or town.
Olney is also an "unincorporated community." This means it's a group of homes and businesses that are not part of an official city or town. Instead, it's governed by the larger county. The community is located along U.S. Route 93, a major highway.
A post office opened in Olney in 1907. It still serves the area with its own ZIP code, 59927. Olney is also close to Lower Stillwater Lake, a nearby body of water.
Climate in Olney: Weather Patterns and Temperatures
The climate of Olney, Montana, shows a wide range of temperatures throughout the year. Summers are generally warm, while winters can be very cold with lots of snow. This area experiences distinct seasons.
| Climate data for Olney, Montana, 1991–2020 normals, 1962–2020 extremes: 3165ft (965m) | |||||||||||||
|---|---|---|---|---|---|---|---|---|---|---|---|---|---|
| Month | Jan | Feb | Mar | Apr | May | Jun | Jul | Aug | Sep | Oct | Nov | Dec | Year |
| Record high °F (°C) | 49 (9) |
62 (17) |
70 (21) |
86 (30) |
93 (34) |
98 (37) |
101 (38) |
100 (38) |
98 (37) |
80 (27) |
65 (18) |
52 (11) |
101 (38) |
| Mean maximum °F (°C) | 42.0 (5.6) |
47.8 (8.8) |
59.3 (15.2) |
72.8 (22.7) |
82.4 (28.0) |
86.8 (30.4) |
92.6 (33.7) |
93.1 (33.9) |
85.3 (29.6) |
70.0 (21.1) |
52.8 (11.6) |
40.5 (4.7) |
94.8 (34.9) |
| Mean daily maximum °F (°C) | 27.9 (−2.3) |
34.1 (1.2) |
42.9 (6.1) |
52.8 (11.6) |
63.2 (17.3) |
69.2 (20.7) |
79.8 (26.6) |
79.6 (26.4) |
68.6 (20.3) |
51.9 (11.1) |
36.0 (2.2) |
26.9 (−2.8) |
52.7 (11.5) |
| Daily mean °F (°C) | 20.0 (−6.7) |
22.9 (−5.1) |
30.9 (−0.6) |
39.4 (4.1) |
48.7 (9.3) |
55.0 (12.8) |
61.5 (16.4) |
60.2 (15.7) |
50.9 (10.5) |
38.6 (3.7) |
27.7 (−2.4) |
20.0 (−6.7) |
39.7 (4.3) |
| Mean daily minimum °F (°C) | 12.1 (−11.1) |
11.8 (−11.2) |
18.9 (−7.3) |
25.9 (−3.4) |
34.1 (1.2) |
40.9 (4.9) |
43.1 (6.2) |
40.7 (4.8) |
33.3 (0.7) |
25.3 (−3.7) |
19.3 (−7.1) |
13.2 (−10.4) |
26.6 (−3.0) |
| Mean minimum °F (°C) | −14.9 (−26.1) |
−14.0 (−25.6) |
2.4 (−16.4) |
14.7 (−9.6) |
22.3 (−5.4) |
28.9 (−1.7) |
33.3 (0.7) |
31.2 (−0.4) |
22.4 (−5.3) |
11.2 (−11.6) |
−1.1 (−18.4) |
−13.2 (−25.1) |
−26.2 (−32.3) |
| Record low °F (°C) | −35 (−37) |
−40 (−40) |
−24 (−31) |
−1 (−18) |
16 (−9) |
24 (−4) |
28 (−2) |
26 (−3) |
12 (−11) |
−10 (−23) |
−25 (−32) |
−44 (−42) |
−44 (−42) |
| Average precipitation inches (mm) | 1.98 (50) |
1.33 (34) |
1.33 (34) |
1.19 (30) |
2.12 (54) |
3.03 (77) |
1.33 (34) |
1.08 (27) |
1.23 (31) |
1.75 (44) |
1.91 (49) |
2.02 (51) |
20.3 (515) |
| Average snowfall inches (cm) | 27.1 (69) |
18.5 (47) |
8.9 (23) |
3.0 (7.6) |
0.2 (0.51) |
0.0 (0.0) |
0.0 (0.0) |
0.0 (0.0) |
0.0 (0.0) |
0.8 (2.0) |
16.5 (42) |
26.5 (67) |
101.5 (258.11) |
| Average extreme snow depth inches (cm) | 32.9 (84) |
30.6 (78) |
22.0 (56) |
5.4 (14) |
0.0 (0.0) |
0.0 (0.0) |
0.0 (0.0) |
0.0 (0.0) |
0.0 (0.0) |
1.2 (3.0) |
8.9 (23) |
25.3 (64) |
43.4 (110) |
| Average precipitation days (≥ 0.01 in) | 10.4 | 7.0 | 8.4 | 7.3 | 10.5 | 12.7 | 6.7 | 5.3 | 7.1 | 9.3 | 10.4 | 10.4 | 105.5 |
| Average snowy days (≥ 0.1 in) | 8.8 | 5.6 | 4.0 | 1.1 | 0.1 | 0.0 | 0.0 | 0.0 | 0.0 | 0.8 | 5.1 | 8.5 | 34 |
| Source 1: NOAA (1981-2010 snowfall) | |||||||||||||
| Source 2: XMACIS2 (records, 1981-2010 monthly max/mins & snow depth) | |||||||||||||
Demographics: Understanding Olney's Population Changes
"Demographics" refers to the study of a population, including its size and how it changes over time. The United States government counts everyone in the country every ten years in a process called the Decennial Census.
| Historical population | |||
|---|---|---|---|
| Census | Pop. | %± | |
| 2010 | 192 | — | |
| 2020 | 186 | −3.1% | |
| U.S. Decennial Census | |||
According to the 2020 census, Olney had a population of 186 people. This is a slight decrease from the 2010 census, when the population was 192 people. These numbers help us understand how the community is growing or shrinking.
See also
 In Spanish: Olney (Montana) para niños
 | Toni Morrison |
 | Barack Obama |
 | Martin Luther King Jr. |
 | Ralph Bunche |


