
Pearson product-moment correlation coefficient facts for kids
Pearson's correlation is a special math tool. It helps us figure out how two different groups of numbers or things are related to each other. Think of it like this: if you have a list of how much ice cream people eat and another list of how many people go swimming, Pearson's correlation can tell you if those two things tend to happen together.
This tool gives us a number called a "correlation coefficient." This number tells us two main things:
- How strong the relationship is: Is it a very clear connection, or is it just a weak one?
- The direction of the relationship: Do both things go up together (like more studying means higher grades)? Or does one go up while the other goes down (like more time playing video games might mean lower grades)?
Many computer programs have a simple command, like "CORREL(list A, list B)," that can quickly calculate this for you.
Pearson's correlation was developed by a smart person named Karl Pearson in the 1880s.
Contents
What Does the Number Mean?
The correlation coefficient is always a number between -1 and +1.
Positive Correlation (Close to +1)
When the number is close to +1, it means there's a strong positive correlation. This means that as one thing goes up, the other thing also tends to go up.
- Example: The more hours you study for a test, the higher your test score tends to be.
Negative Correlation (Close to -1)
When the number is close to -1, it means there's a strong negative correlation. This means that as one thing goes up, the other thing tends to go down.
- Example: The more hours you spend playing video games, the lower your sleep hours might be.
No Correlation (Close to 0)
When the number is close to 0, it means there's almost no correlation. The two things don't seem to be related at all.
- Example: The number of shoes you own probably has no connection to how many times it rains in a month.
How Is It Calculated?
While computers do the hard work, the idea behind Pearson's correlation involves comparing how much each number in a group is different from its average. It looks at these differences for both groups and then combines them in a special way to get that final correlation number. It's a bit like finding the average of each list, then seeing how far away each number is from that average, and finally, multiplying and adding those differences in a specific order.
Images for kids
-
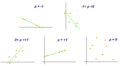
Examples of scatter diagrams showing different types of correlation.

See also
 In Spanish: Coeficiente de correlación de Pearson para niños
